Cuban Married-Couple Family Poverty
COMPARE
Cuban
Select to Compare
Married-Couple Family Poverty
Cuban Married-Couple Family Poverty
6.8%
POVERTY | MARRIED-COUPLE FAMILIES
0.0/ 100
METRIC RATING
304th/ 347
METRIC RANK
Cuban Married-Couple Family Poverty Correlation Chart
The statistical analysis conducted on geographies consisting of 444,866,425 people shows a poor positive correlation between the proportion of Cubans and poverty level among married-couple families in the United States with a correlation coefficient (R) of 0.155 and weighted average of 6.8%. On average, for every 1% (one percent) increase in Cubans within a typical geography, there is an increase of 0.022% in poverty level among married-couple families.
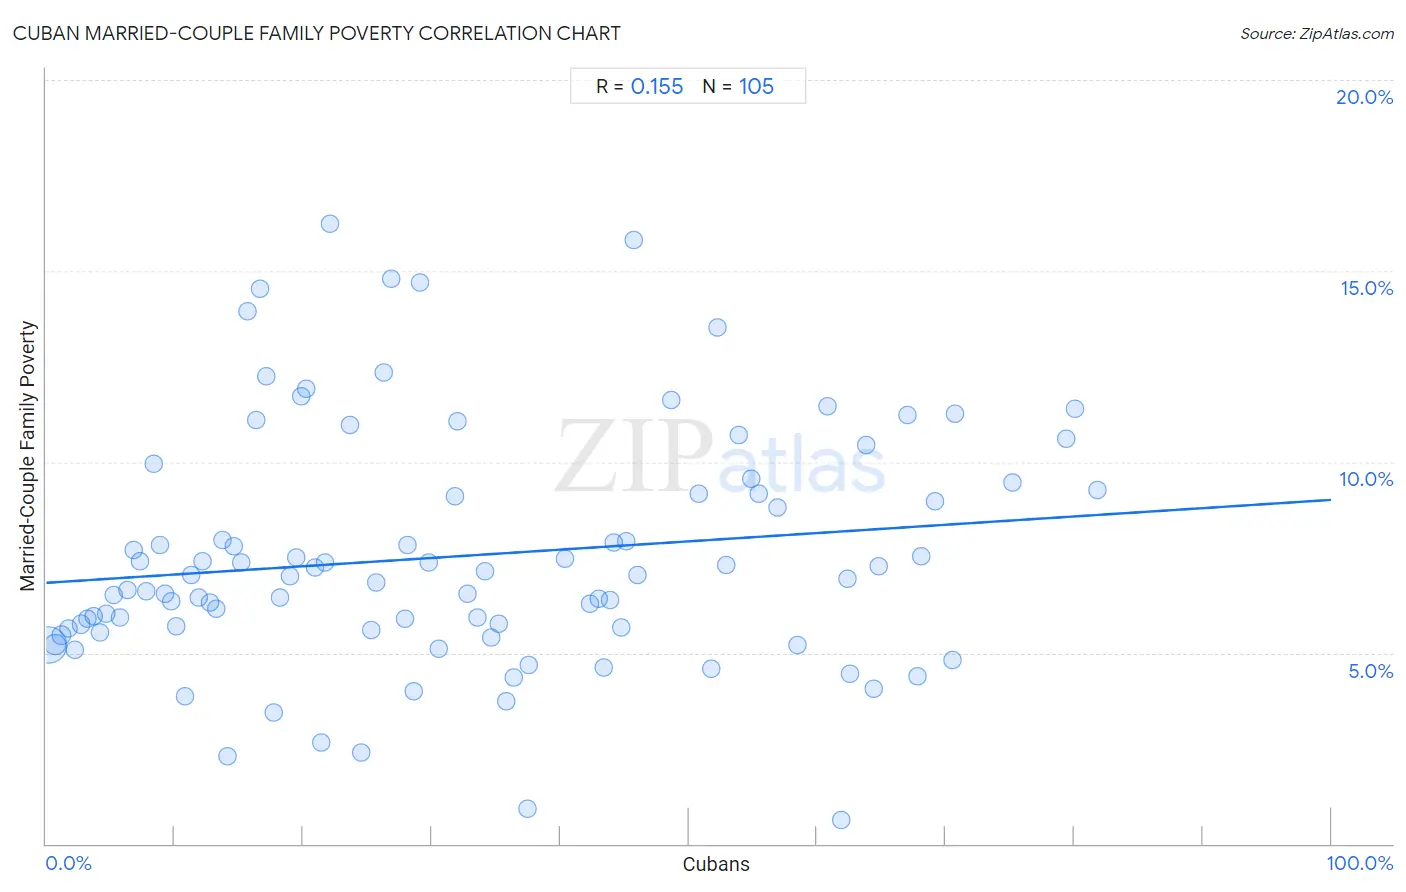
It is essential to understand that the correlation between the percentage of Cubans and poverty level among married-couple families does not imply a direct cause-and-effect relationship. It remains uncertain whether the presence of Cubans influences an upward or downward trend in the level of poverty level among married-couple families within an area, or if Cubans simply ended up residing in those areas with higher or lower levels of poverty level among married-couple families due to other factors.
Demographics Similar to Cubans by Married-Couple Family Poverty
In terms of married-couple family poverty, the demographic groups most similar to Cubans are Haitian (6.8%, a difference of 0.10%), Immigrants from El Salvador (6.8%, a difference of 0.44%), Immigrants from Ecuador (6.7%, a difference of 0.72%), Central American (6.7%, a difference of 0.86%), and Immigrants from Belize (6.7%, a difference of 1.5%).
| Demographics | Rating | Rank | Married-Couple Family Poverty |
| Kiowa | 0.0 /100 | #297 | Tragic 6.6% |
| Immigrants from Guyana | 0.0 /100 | #298 | Tragic 6.7% |
| Nicaraguans | 0.0 /100 | #299 | Tragic 6.7% |
| Immigrants from Belize | 0.0 /100 | #300 | Tragic 6.7% |
| Central Americans | 0.0 /100 | #301 | Tragic 6.7% |
| Immigrants from Ecuador | 0.0 /100 | #302 | Tragic 6.7% |
| Immigrants from El Salvador | 0.0 /100 | #303 | Tragic 6.8% |
| Cubans | 0.0 /100 | #304 | Tragic 6.8% |
| Haitians | 0.0 /100 | #305 | Tragic 6.8% |
| Immigrants from Haiti | 0.0 /100 | #306 | Tragic 7.0% |
| Guatemalans | 0.0 /100 | #307 | Tragic 7.0% |
| Spanish American Indians | 0.0 /100 | #308 | Tragic 7.1% |
| Hopi | 0.0 /100 | #309 | Tragic 7.1% |
| Immigrants from Nicaragua | 0.0 /100 | #310 | Tragic 7.1% |
| Immigrants from Dominica | 0.0 /100 | #311 | Tragic 7.1% |
Cuban Married-Couple Family Poverty Correlation Summary
| Measurement | Cuban Data | Married-Couple Family Poverty Data |
| Minimum | 0.21% | 0.61% |
| Maximum | 81.9% | 16.2% |
| Range | 81.6% | 15.6% |
| Mean | 32.0% | 7.5% |
| Median | 28.2% | 7.0% |
| Interquartile 25% (IQ1) | 13.0% | 5.6% |
| Interquartile 75% (IQ3) | 49.7% | 9.2% |
| Interquartile Range (IQR) | 36.7% | 3.6% |
| Standard Deviation (Sample) | 22.3% | 3.1% |
| Standard Deviation (Population) | 22.2% | 3.1% |
Correlation Details
| Cuban Percentile | Sample Size | Married-Couple Family Poverty |
[ 0.0% - 0.5% ] 0.21% | 331,235,254 | 5.2% |
[ 0.5% - 1.0% ] 0.69% | 59,619,832 | 5.2% |
[ 1.0% - 1.5% ] 1.21% | 16,490,246 | 5.5% |
[ 1.5% - 2.0% ] 1.70% | 9,628,195 | 5.6% |
[ 2.0% - 2.5% ] 2.24% | 5,550,504 | 5.1% |
[ 2.5% - 3.0% ] 2.73% | 4,698,784 | 5.7% |
[ 3.0% - 3.5% ] 3.24% | 2,276,785 | 5.9% |
[ 3.5% - 4.0% ] 3.73% | 1,849,945 | 6.0% |
[ 4.0% - 4.5% ] 4.22% | 1,136,986 | 5.5% |
[ 4.5% - 5.0% ] 4.71% | 818,653 | 6.0% |
[ 5.0% - 5.5% ] 5.27% | 833,465 | 6.5% |
[ 5.5% - 6.0% ] 5.70% | 720,792 | 5.9% |
[ 6.0% - 6.5% ] 6.28% | 524,426 | 6.6% |
[ 6.5% - 7.0% ] 6.78% | 346,341 | 7.7% |
[ 7.0% - 7.5% ] 7.31% | 454,510 | 7.4% |
[ 7.5% - 8.0% ] 7.75% | 855,188 | 6.6% |
[ 8.0% - 8.5% ] 8.34% | 343,696 | 10.0% |
[ 8.5% - 9.0% ] 8.86% | 331,024 | 7.8% |
[ 9.0% - 9.5% ] 9.27% | 247,459 | 6.5% |
[ 9.5% - 10.0% ] 9.71% | 126,271 | 6.3% |
[ 10.0% - 10.5% ] 10.11% | 280,532 | 5.7% |
[ 10.5% - 11.0% ] 10.76% | 169,217 | 3.9% |
[ 11.0% - 11.5% ] 11.25% | 199,138 | 7.0% |
[ 11.5% - 12.0% ] 11.82% | 84,624 | 6.4% |
[ 12.0% - 12.5% ] 12.15% | 190,194 | 7.4% |
[ 12.5% - 13.0% ] 12.79% | 139,261 | 6.3% |
[ 13.0% - 13.5% ] 13.25% | 253,159 | 6.2% |
[ 13.5% - 14.0% ] 13.75% | 142,462 | 8.0% |
[ 14.0% - 14.5% ] 14.07% | 31,399 | 2.3% |
[ 14.5% - 15.0% ] 14.62% | 100,449 | 7.8% |
[ 15.0% - 15.5% ] 15.14% | 354,114 | 7.4% |
[ 15.5% - 16.0% ] 15.67% | 7,385 | 13.9% |
[ 16.0% - 16.5% ] 16.37% | 55,764 | 11.1% |
[ 16.5% - 17.0% ] 16.65% | 17,817 | 14.5% |
[ 17.0% - 17.5% ] 17.12% | 142,560 | 12.2% |
[ 17.5% - 18.0% ] 17.73% | 84,471 | 3.4% |
[ 18.0% - 18.5% ] 18.15% | 182,425 | 6.5% |
[ 18.5% - 19.0% ] 18.94% | 74,371 | 7.0% |
[ 19.0% - 19.5% ] 19.48% | 13,265 | 7.5% |
[ 19.5% - 20.0% ] 19.81% | 96,744 | 11.7% |
[ 20.0% - 20.5% ] 20.27% | 80,415 | 11.9% |
[ 20.5% - 21.0% ] 20.89% | 110,246 | 7.2% |
[ 21.0% - 21.5% ] 21.40% | 53,076 | 2.7% |
[ 21.5% - 22.0% ] 21.70% | 40,853 | 7.4% |
[ 22.0% - 22.5% ] 22.05% | 77,008 | 16.2% |
[ 23.5% - 24.0% ] 23.67% | 50,571 | 11.0% |
[ 24.5% - 25.0% ] 24.54% | 10,520 | 2.4% |
[ 25.0% - 25.5% ] 25.25% | 123,956 | 5.6% |
[ 25.5% - 26.0% ] 25.70% | 125,937 | 6.8% |
[ 26.0% - 26.5% ] 26.23% | 33,851 | 12.3% |
[ 26.5% - 27.0% ] 26.84% | 56,068 | 14.8% |
[ 27.5% - 28.0% ] 27.92% | 15,184 | 5.9% |
[ 28.0% - 28.5% ] 28.15% | 96,294 | 7.8% |
[ 28.5% - 29.0% ] 28.65% | 81,384 | 4.0% |
[ 29.0% - 29.5% ] 29.11% | 35,969 | 14.7% |
[ 29.5% - 30.0% ] 29.72% | 44,956 | 7.4% |
[ 30.5% - 31.0% ] 30.57% | 69,152 | 5.1% |
[ 31.5% - 32.0% ] 31.84% | 112,692 | 9.1% |
[ 32.0% - 32.5% ] 32.04% | 497,852 | 11.1% |
[ 32.5% - 33.0% ] 32.78% | 150,531 | 6.6% |
[ 33.5% - 34.0% ] 33.61% | 80,738 | 5.9% |
[ 34.0% - 34.5% ] 34.13% | 46,844 | 7.1% |
[ 34.5% - 35.0% ] 34.64% | 78,402 | 5.4% |
[ 35.0% - 35.5% ] 35.19% | 147,444 | 5.8% |
[ 35.5% - 36.0% ] 35.76% | 17,902 | 3.7% |
[ 36.0% - 36.5% ] 36.37% | 23,094 | 4.4% |
[ 37.0% - 37.5% ] 37.45% | 2,318 | 0.91% |
[ 37.5% - 38.0% ] 37.56% | 26,994 | 4.7% |
[ 40.0% - 40.5% ] 40.39% | 40,278 | 7.5% |
[ 42.0% - 42.5% ] 42.36% | 88,933 | 6.3% |
[ 42.5% - 43.0% ] 42.99% | 29,240 | 6.4% |
[ 43.0% - 43.5% ] 43.35% | 76,412 | 4.6% |
[ 43.5% - 44.0% ] 43.83% | 105,481 | 6.4% |
[ 44.0% - 44.5% ] 44.15% | 56,791 | 7.9% |
[ 44.5% - 45.0% ] 44.76% | 45,669 | 5.7% |
[ 45.0% - 45.5% ] 45.18% | 35,705 | 7.9% |
[ 45.5% - 46.0% ] 45.68% | 68,602 | 15.8% |
[ 46.0% - 46.5% ] 46.05% | 33,026 | 7.1% |
[ 48.5% - 49.0% ] 48.64% | 81,858 | 11.6% |
[ 50.5% - 51.0% ] 50.74% | 3,400 | 9.2% |
[ 51.5% - 52.0% ] 51.73% | 34,335 | 4.6% |
[ 52.0% - 52.5% ] 52.27% | 13,163 | 13.5% |
[ 52.5% - 53.0% ] 52.97% | 29,530 | 7.3% |
[ 53.5% - 54.0% ] 53.91% | 42,710 | 10.7% |
[ 54.5% - 55.0% ] 54.83% | 34,057 | 9.6% |
[ 55.0% - 55.5% ] 55.44% | 19,399 | 9.2% |
[ 56.5% - 57.0% ] 56.95% | 52,661 | 8.8% |
[ 58.0% - 58.5% ] 58.48% | 43,702 | 5.2% |
[ 60.5% - 61.0% ] 60.80% | 52,101 | 11.5% |
[ 61.5% - 62.0% ] 61.83% | 30,621 | 0.61% |
[ 62.0% - 62.5% ] 62.37% | 13,877 | 6.9% |
[ 62.5% - 63.0% ] 62.57% | 55,241 | 4.5% |
[ 63.5% - 64.0% ] 63.81% | 52,851 | 10.5% |
[ 64.0% - 64.5% ] 64.40% | 53,765 | 4.1% |
[ 64.5% - 65.0% ] 64.80% | 24,597 | 7.3% |
[ 67.0% - 67.5% ] 67.07% | 45,620 | 11.2% |
[ 67.5% - 68.0% ] 67.76% | 104,796 | 4.4% |
[ 68.0% - 68.5% ] 68.14% | 10,725 | 7.5% |
[ 69.0% - 69.5% ] 69.21% | 20,850 | 9.0% |
[ 70.0% - 70.5% ] 70.48% | 53,065 | 4.8% |
[ 70.5% - 71.0% ] 70.69% | 22,815 | 11.3% |
[ 75.0% - 75.5% ] 75.16% | 249,592 | 9.5% |
[ 79.0% - 79.5% ] 79.36% | 42,081 | 10.6% |
[ 80.0% - 80.5% ] 80.06% | 71,088 | 11.4% |
[ 81.5% - 82.0% ] 81.85% | 29,830 | 9.3% |