Chilean Married-Couple Family Poverty

COMPARE

Chilean
Race
Ancestry
AfghanAfricanAlaska NativeAlaskan AthabascanAlbanianAleutAlsatianAmericanApacheArabArapahoArgentineanArmenianAssyrian/Chaldean/SyriacAustralianAustrianBahamianBangladeshiBarbadianBasqueBelgianBelizeanBermudanBhutaneseBlackfeetBolivianBrazilianBritishBritish West IndianBulgarianBurmeseCajunCambodianCanadianCape VerdeanCarpatho RusynCelticCentral AmericanCentral American IndianCherokeeCheyenneChickasawChileanChineseChippewaChoctawColombianColvilleComancheCosta RicanCreeCreekCroatianCrowCubanCypriotCzechCzechoslovakianDanishDelawareDominicanDutchDutch West IndianEastern EuropeanEcuadorianEgyptianEnglishEstonianEthiopianEuropeanFijianFilipinoFinnishFrenchFrench American IndianFrench CanadianGermanGerman RussianGhanaianGreekGuamanian/ChamorroGuatemalanGuyaneseHaitianHmongHonduranHopiHoumaHungarianIcelanderIndian (Asian)IndonesianInupiatIranianIraqiIrishIroquoisIsraeliItalianJamaicanJapaneseJordanianKenyanKiowaKoreanLaotianLatvianLebaneseLiberianLithuanianLumbeeLuxembourgerMacedonianMalaysianMalteseMarshalleseMenomineeMexicanMexican American IndianMongolianMoroccanNative HawaiianNavajoNepaleseNew ZealanderNicaraguanNigerianNorthern EuropeanNorwegianOkinawanOsageOttawaPaiutePakistaniPalestinianPanamanianParaguayanPennsylvania GermanPeruvianPimaPolishPortuguesePotawatomiPuebloPuerto RicanPuget Sound SalishRomanianRussianSalvadoranSamoanScandinavianScotch-IrishScottishSeminoleSenegaleseSerbianShoshoneSierra LeoneanSiouxSlavicSlovakSloveneSomaliSouth AfricanSouth AmericanSouth American IndianSoviet UnionSpaniardSpanishSpanish AmericanSpanish American IndianSri LankanSubsaharan AfricanSudaneseSwedishSwissSyrianTaiwaneseThaiTlingit-HaidaTohono O'OdhamTonganTrinidadian and TobagonianTsimshianTurkishU.S. Virgin IslanderUgandanUkrainianUruguayanUteVenezuelanVietnameseWelshWest IndianYakamaYaquiYugoslavianYumanYup'ikZimbabwean
Immigration
NonimmigrantsImmigrantsAfghanistanAfricaAlbaniaArgentinaArmeniaAsiaAustraliaAustriaBahamasBangladeshBarbadosBelarusBelgiumBelizeBoliviaBosnia and HerzegovinaBrazilBulgariaBurma/MyanmarCabo VerdeCambodiaCameroonCanadaCaribbeanCentral AmericaChileChinaColombiaCongoCosta RicaCroatiaCubaCzechoslovakiaDenmarkDominicaDominican RepublicEastern AfricaEastern AsiaEastern EuropeEcuadorEgyptEl SalvadorEnglandEritreaEthiopiaEuropeFijiFranceGermanyGhanaGreeceGrenadaGuatemalaGuyanaHaitiHondurasHong KongHungaryIndiaIndonesiaIranIraqIrelandIsraelItalyJamaicaJapanJordanKazakhstanKenyaKoreaKuwaitLaosLatin AmericaLatviaLebanonLiberiaLithuaniaMalaysiaMexicoMicronesiaMiddle AfricaMoldovaMoroccoNepalNetherlandsNicaraguaNigeriaNorth AmericaNorth MacedoniaNorthern AfricaNorthern EuropeNorwayOceaniaPakistanPanamaPeruPhilippinesPolandPortugalRomaniaRussiaSaudi ArabiaScotlandSenegalSerbiaSierra LeoneSingaporeSomaliaSouth AfricaSouth AmericaSouth Central AsiaSouth Eastern AsiaSouthern EuropeSpainSri LankaSt. Vincent and the GrenadinesSudanSwedenSwitzerlandSyriaTaiwanThailandTrinidad and TobagoTurkeyUgandaUkraineUruguayUzbekistanVenezuelaVietnamWest IndiesWestern AfricaWestern AsiaWestern EuropeYemenZaireZimbabweAzores
Select to Compare
Race
Ancestry
AfghanAfricanAlaska NativeAlaskan AthabascanAlbanianAleutAlsatianAmericanApacheArabArapahoArgentineanArmenianAssyrian/Chaldean/SyriacAustralianAustrianBahamianBangladeshiBarbadianBasqueBelgianBelizeanBermudanBhutaneseBlackfeetBolivianBrazilianBritishBritish West IndianBulgarianBurmeseCajunCambodianCanadianCape VerdeanCarpatho RusynCelticCentral AmericanCentral American IndianCherokeeCheyenneChickasawChineseChippewaChoctawColombianColvilleComancheCosta RicanCreeCreekCroatianCrowCubanCypriotCzechCzechoslovakianDanishDelawareDominicanDutchDutch West IndianEastern EuropeanEcuadorianEgyptianEnglishEstonianEthiopianEuropeanFijianFilipinoFinnishFrenchFrench American IndianFrench CanadianGermanGerman RussianGhanaianGreekGuamanian/ChamorroGuatemalanGuyaneseHaitianHmongHonduranHopiHoumaHungarianIcelanderIndian (Asian)IndonesianInupiatIranianIraqiIrishIroquoisIsraeliItalianJamaicanJapaneseJordanianKenyanKiowaKoreanLaotianLatvianLebaneseLiberianLithuanianLumbeeLuxembourgerMacedonianMalaysianMalteseMarshalleseMenomineeMexicanMexican American IndianMongolianMoroccanNative HawaiianNavajoNepaleseNew ZealanderNicaraguanNigerianNorthern EuropeanNorwegianOkinawanOsageOttawaPaiutePakistaniPalestinianPanamanianParaguayanPennsylvania GermanPeruvianPimaPolishPortuguesePotawatomiPuebloPuerto RicanPuget Sound SalishRomanianRussianSalvadoranSamoanScandinavianScotch-IrishScottishSeminoleSenegaleseSerbianShoshoneSierra LeoneanSiouxSlavicSlovakSloveneSomaliSouth AfricanSouth AmericanSouth American IndianSoviet UnionSpaniardSpanishSpanish AmericanSpanish American IndianSri LankanSubsaharan AfricanSudaneseSwedishSwissSyrianTaiwaneseThaiTlingit-HaidaTohono O'OdhamTonganTrinidadian and TobagonianTsimshianTurkishU.S. Virgin IslanderUgandanUkrainianUruguayanUteVenezuelanVietnameseWelshWest IndianYakamaYaquiYugoslavianYumanYup'ikZimbabwean
Immigration
NonimmigrantsImmigrantsAfghanistanAfricaAlbaniaArgentinaArmeniaAsiaAustraliaAustriaBahamasBangladeshBarbadosBelarusBelgiumBelizeBoliviaBosnia and HerzegovinaBrazilBulgariaBurma/MyanmarCabo VerdeCambodiaCameroonCanadaCaribbeanCentral AmericaChileChinaColombiaCongoCosta RicaCroatiaCubaCzechoslovakiaDenmarkDominicaDominican RepublicEastern AfricaEastern AsiaEastern EuropeEcuadorEgyptEl SalvadorEnglandEritreaEthiopiaEuropeFijiFranceGermanyGhanaGreeceGrenadaGuatemalaGuyanaHaitiHondurasHong KongHungaryIndiaIndonesiaIranIraqIrelandIsraelItalyJamaicaJapanJordanKazakhstanKenyaKoreaKuwaitLaosLatin AmericaLatviaLebanonLiberiaLithuaniaMalaysiaMexicoMicronesiaMiddle AfricaMoldovaMoroccoNepalNetherlandsNicaraguaNigeriaNorth AmericaNorth MacedoniaNorthern AfricaNorthern EuropeNorwayOceaniaPakistanPanamaPeruPhilippinesPolandPortugalRomaniaRussiaSaudi ArabiaScotlandSenegalSerbiaSierra LeoneSingaporeSomaliaSouth AfricaSouth AmericaSouth Central AsiaSouth Eastern AsiaSouthern EuropeSpainSri LankaSt. Vincent and the GrenadinesSudanSwedenSwitzerlandSyriaTaiwanThailandTrinidad and TobagoTurkeyUgandaUkraineUruguayUzbekistanVenezuelaVietnamWest IndiesWestern AfricaWestern AsiaWestern EuropeYemenZaireZimbabweAzores
Married-Couple Family Poverty
Income
Poverty
Unemployment
Labor Participation
Family Structure
Vehicle Availability
Education Level
Disability

Chilean Married-Couple Family Poverty
Excellent

4.9%
POVERTY | MARRIED-COUPLE FAMILIES
86.0/ 100
METRIC RATING
138th/ 347
METRIC RANK

Chilean Married-Couple Family Poverty Correlation Chart

The statistical analysis conducted on geographies consisting of 255,436,750 people shows a weak positive correlation between the proportion of Chileans and poverty level among married-couple families in the United States with a correlation coefficient (R) of 0.261 and weighted average of 4.9%. On average, for every 1% (one percent) increase in Chileans within a typical geography, there is an increase of 0.24% in poverty level among married-couple families.
Chilean Married-Couple Family Poverty
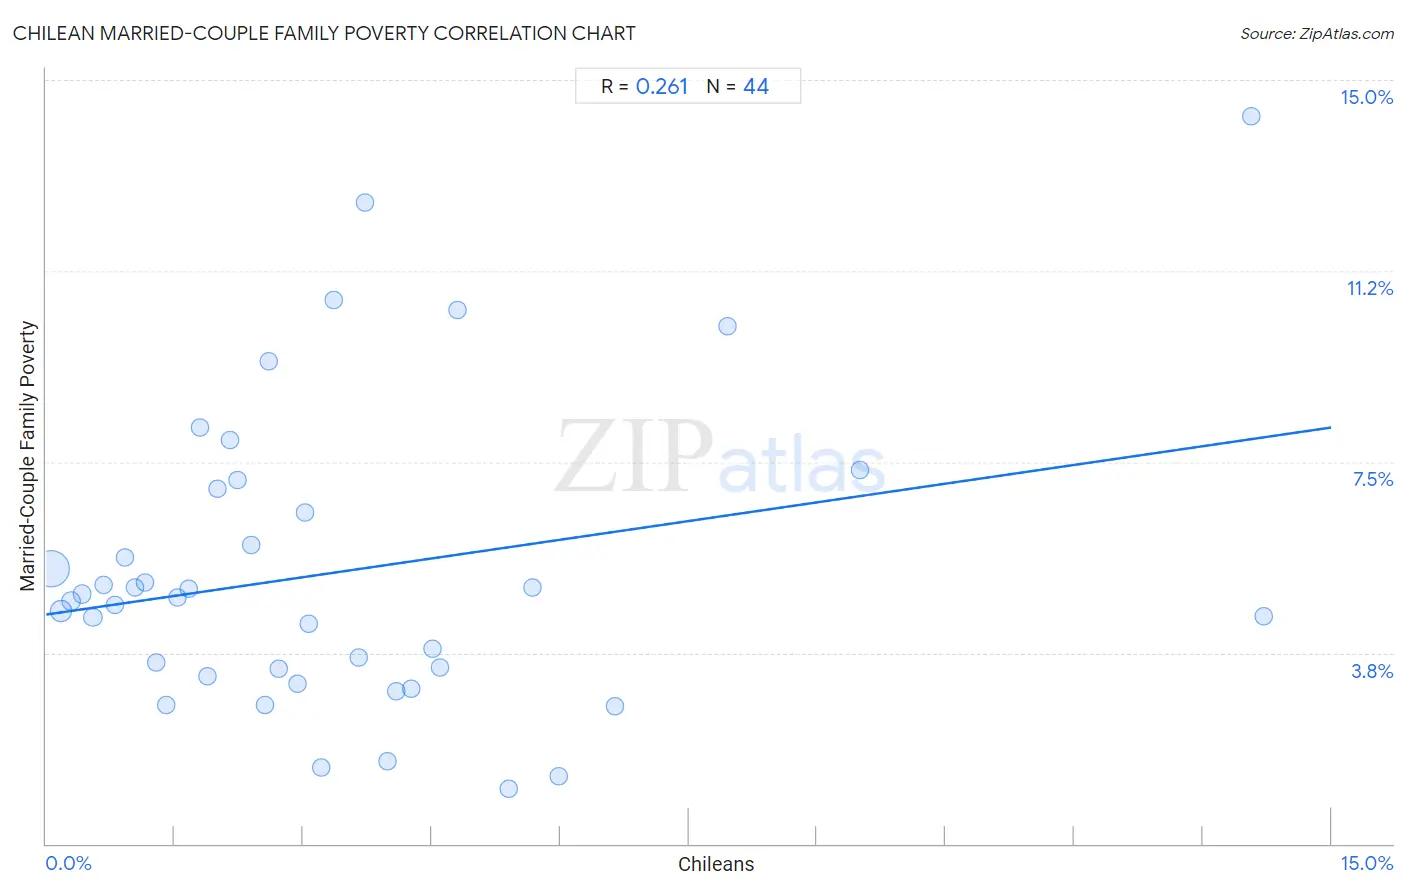
It is essential to understand that the correlation between the percentage of Chileans and poverty level among married-couple families does not imply a direct cause-and-effect relationship. It remains uncertain whether the presence of Chileans influences an upward or downward trend in the level of poverty level among married-couple families within an area, or if Chileans simply ended up residing in those areas with higher or lower levels of poverty level among married-couple families due to other factors.

Demographics Similar to Chileans by Married-Couple Family Poverty

In terms of married-couple family poverty, the demographic groups most similar to Chileans are Guamanian/Chamorro (4.9%, a difference of 0.13%), German Russian (5.0%, a difference of 0.23%), Immigrants from Portugal (5.0%, a difference of 0.29%), Immigrants from Brazil (5.0%, a difference of 0.34%), and Immigrants from China (5.0%, a difference of 0.34%).
DemographicsRating | RankMarried-Couple Family Poverty
Immigrants from Eastern Europe
90.5
/100
|
#131
Exceptional
4.9%
Puget Sound Salish
90.4
/100
|
#132
Exceptional
4.9%
Immigrants from Kenya
90.2
/100
|
#133
Exceptional
4.9%
Samoans
90.2
/100
|
#134
Exceptional
4.9%
Assyrians/Chaldeans/Syriacs
89.4
/100
|
#135
Excellent
4.9%
Immigrants from Hungary
88.7
/100
|
#136
Excellent
4.9%
Guamanians/Chamorros
86.5
/100
|
#137
Excellent
4.9%
Chileans
86.0
/100
|
#138
Excellent
4.9%
German Russians
85.1
/100
|
#139
Excellent
5.0%
Immigrants from Portugal
84.8
/100
|
#140
Excellent
5.0%
Immigrants from Brazil
84.6
/100
|
#141
Excellent
5.0%
Immigrants from China
84.6
/100
|
#142
Excellent
5.0%
Immigrants from Egypt
83.4
/100
|
#143
Excellent
5.0%
Hmong
83.2
/100
|
#144
Excellent
5.0%
Immigrants from Spain
79.9
/100
|
#145
Good
5.0%

Chilean Married-Couple Family Poverty Correlation Summary

MeasurementChilean DataMarried-Couple Family Poverty Data
Minimum0.054%1.1%
Maximum14.2%14.3%
Range14.2%13.2%
Mean3.4%5.3%
Median2.7%4.8%
Interquartile 25% (IQ1)1.3%3.4%
Interquartile 75% (IQ3)4.4%6.7%
Interquartile Range (IQR)3.0%3.4%
Standard Deviation (Sample)3.2%3.0%
Standard Deviation (Population)3.1%2.9%

Correlation Details

Chilean PercentileSample SizeMarried-Couple Family Poverty
[
0.0%
-
0.5%
]
0.054%
182,079,9105.4%
[
0.0%
-
0.5%
]
0.17%
41,081,7454.6%
[
0.0%
-
0.5%
]
0.30%
15,056,8794.8%
[
0.0%
-
0.5%
]
0.42%
6,480,7614.9%
[
0.5%
-
1.0%
]
0.55%
3,814,5534.5%
[
0.5%
-
1.0%
]
0.67%
2,175,3575.1%
[
0.5%
-
1.0%
]
0.80%
1,546,0374.7%
[
0.5%
-
1.0%
]
0.92%
946,2605.6%
[
1.0%
-
1.5%
]
1.04%
644,7685.0%
[
1.0%
-
1.5%
]
1.16%
499,7435.1%
[
1.0%
-
1.5%
]
1.28%
326,8263.6%
[
1.0%
-
1.5%
]
1.40%
130,6312.7%
[
1.5%
-
2.0%
]
1.54%
89,3054.8%
[
1.5%
-
2.0%
]
1.66%
119,5485.0%
[
1.5%
-
2.0%
]
1.80%
72,0618.2%
[
1.5%
-
2.0%
]
1.88%
78,0733.3%
[
2.0%
-
2.5%
]
2.00%
35,8817.0%
[
2.0%
-
2.5%
]
2.15%
21,1487.9%
[
2.0%
-
2.5%
]
2.24%
38,5517.1%
[
2.0%
-
2.5%
]
2.40%
15,2995.9%
[
2.5%
-
3.0%
]
2.56%
2,3082.7%
[
2.5%
-
3.0%
]
2.60%
1,2339.5%
[
2.5%
-
3.0%
]
2.71%
10,7463.4%
[
2.5%
-
3.0%
]
2.93%
8,9183.1%
[
3.0%
-
3.5%
]
3.01%
15,8926.5%
[
3.0%
-
3.5%
]
3.07%
29,2114.3%
[
3.0%
-
3.5%
]
3.21%
8,1041.5%
[
3.0%
-
3.5%
]
3.35%
20,44810.7%
[
3.5%
-
4.0%
]
3.65%
1,2343.7%
[
3.5%
-
4.0%
]
3.72%
3,03512.6%
[
3.5%
-
4.0%
]
3.98%
19,2391.6%
[
4.0%
-
4.5%
]
4.09%
25,9943.0%
[
4.0%
-
4.5%
]
4.26%
2,3463.0%
[
4.5%
-
5.0%
]
4.50%
3,6203.8%
[
4.5%
-
5.0%
]
4.60%
14,3613.5%
[
4.5%
-
5.0%
]
4.80%
91710.5%
[
5.0%
-
5.5%
]
5.40%
5371.1%
[
5.5%
-
6.0%
]
5.68%
3,9435.0%
[
5.5%
-
6.0%
]
5.99%
1,9041.3%
[
6.5%
-
7.0%
]
6.64%
4,1692.7%
[
7.5%
-
8.0%
]
7.95%
1,62210.2%
[
9.0%
-
9.5%
]
9.49%
2,6127.3%
[
14.0%
-
14.5%
]
14.06%
6414.3%
[
14.0%
-
14.5%
]
14.21%
9574.5%