Czech Married-Couple Family Poverty
COMPARE
Czech
Select to Compare
Married-Couple Family Poverty
Czech Married-Couple Family Poverty
4.0%
POVERTY | MARRIED-COUPLE FAMILIES
100.0/ 100
METRIC RATING
13th/ 347
METRIC RANK
Czech Married-Couple Family Poverty Correlation Chart
The statistical analysis conducted on geographies consisting of 476,498,804 people shows a poor positive correlation between the proportion of Czechs and poverty level among married-couple families in the United States with a correlation coefficient (R) of 0.106 and weighted average of 4.0%. On average, for every 1% (one percent) increase in Czechs within a typical geography, there is an increase of 0.034% in poverty level among married-couple families.
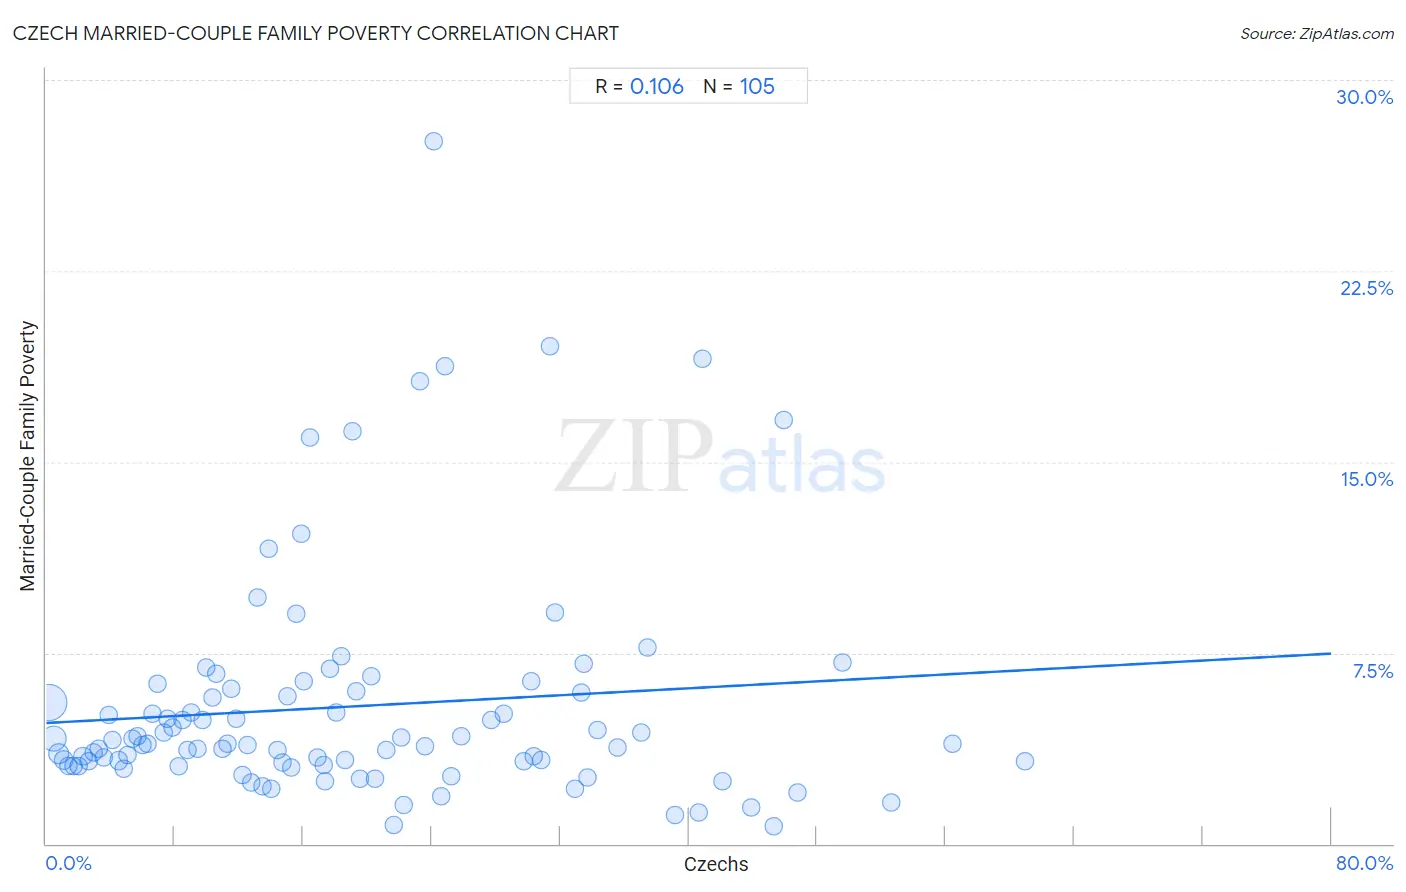
It is essential to understand that the correlation between the percentage of Czechs and poverty level among married-couple families does not imply a direct cause-and-effect relationship. It remains uncertain whether the presence of Czechs influences an upward or downward trend in the level of poverty level among married-couple families within an area, or if Czechs simply ended up residing in those areas with higher or lower levels of poverty level among married-couple families due to other factors.
Demographics Similar to Czechs by Married-Couple Family Poverty
In terms of married-couple family poverty, the demographic groups most similar to Czechs are Slovak (4.0%, a difference of 0.040%), Polish (4.0%, a difference of 0.070%), German (4.0%, a difference of 0.34%), Filipino (4.0%, a difference of 0.37%), and Italian (4.0%, a difference of 0.38%).
| Demographics | Rating | Rank | Married-Couple Family Poverty |
| Luxembourgers | 100.0 /100 | #6 | Exceptional 3.9% |
| Latvians | 100.0 /100 | #7 | Exceptional 3.9% |
| Thais | 100.0 /100 | #8 | Exceptional 3.9% |
| Croatians | 100.0 /100 | #9 | Exceptional 3.9% |
| Carpatho Rusyns | 100.0 /100 | #10 | Exceptional 3.9% |
| Lithuanians | 100.0 /100 | #11 | Exceptional 4.0% |
| Bulgarians | 100.0 /100 | #12 | Exceptional 4.0% |
| Czechs | 100.0 /100 | #13 | Exceptional 4.0% |
| Slovaks | 100.0 /100 | #14 | Exceptional 4.0% |
| Poles | 100.0 /100 | #15 | Exceptional 4.0% |
| Germans | 100.0 /100 | #16 | Exceptional 4.0% |
| Filipinos | 100.0 /100 | #17 | Exceptional 4.0% |
| Italians | 100.0 /100 | #18 | Exceptional 4.0% |
| Immigrants from Ireland | 99.9 /100 | #19 | Exceptional 4.1% |
| Maltese | 99.9 /100 | #20 | Exceptional 4.1% |
Czech Married-Couple Family Poverty Correlation Summary
| Measurement | Czech Data | Married-Couple Family Poverty Data |
| Minimum | 0.15% | 0.69% |
| Maximum | 60.9% | 27.6% |
| Range | 60.7% | 26.9% |
| Mean | 19.2% | 5.4% |
| Median | 16.1% | 3.9% |
| Interquartile 25% (IQ1) | 8.0% | 3.1% |
| Interquartile 75% (IQ3) | 29.1% | 6.0% |
| Interquartile Range (IQR) | 21.1% | 2.9% |
| Standard Deviation (Sample) | 14.1% | 4.5% |
| Standard Deviation (Population) | 14.0% | 4.5% |
Correlation Details
| Czech Percentile | Sample Size | Married-Couple Family Poverty |
[ 0.0% - 0.5% ] 0.15% | 275,453,883 | 5.6% |
[ 0.0% - 0.5% ] 0.43% | 113,985,391 | 4.1% |
[ 0.5% - 1.0% ] 0.75% | 38,234,230 | 3.5% |
[ 1.0% - 1.5% ] 1.06% | 18,538,084 | 3.3% |
[ 1.0% - 1.5% ] 1.38% | 10,245,110 | 3.1% |
[ 1.5% - 2.0% ] 1.69% | 6,168,549 | 3.0% |
[ 2.0% - 2.5% ] 2.01% | 3,790,922 | 3.1% |
[ 2.0% - 2.5% ] 2.29% | 2,023,265 | 3.4% |
[ 2.5% - 3.0% ] 2.61% | 1,532,828 | 3.2% |
[ 2.5% - 3.0% ] 2.92% | 1,072,749 | 3.6% |
[ 3.0% - 3.5% ] 3.23% | 1,258,788 | 3.8% |
[ 3.5% - 4.0% ] 3.55% | 540,963 | 3.4% |
[ 3.5% - 4.0% ] 3.89% | 389,934 | 5.0% |
[ 4.0% - 4.5% ] 4.13% | 572,989 | 4.1% |
[ 4.0% - 4.5% ] 4.49% | 590,250 | 3.3% |
[ 4.5% - 5.0% ] 4.79% | 441,165 | 3.0% |
[ 5.0% - 5.5% ] 5.06% | 294,886 | 3.5% |
[ 5.0% - 5.5% ] 5.36% | 255,581 | 4.1% |
[ 5.5% - 6.0% ] 5.65% | 82,218 | 4.2% |
[ 5.5% - 6.0% ] 6.00% | 85,876 | 3.9% |
[ 6.0% - 6.5% ] 6.29% | 68,549 | 3.9% |
[ 6.5% - 7.0% ] 6.63% | 113,468 | 5.1% |
[ 6.5% - 7.0% ] 6.96% | 64,537 | 6.3% |
[ 7.0% - 7.5% ] 7.33% | 62,492 | 4.4% |
[ 7.5% - 8.0% ] 7.56% | 56,262 | 4.9% |
[ 7.5% - 8.0% ] 7.84% | 62,486 | 4.6% |
[ 8.0% - 8.5% ] 8.23% | 56,564 | 3.1% |
[ 8.0% - 8.5% ] 8.48% | 38,438 | 4.9% |
[ 8.5% - 9.0% ] 8.80% | 25,809 | 3.7% |
[ 9.0% - 9.5% ] 9.04% | 12,161 | 5.2% |
[ 9.0% - 9.5% ] 9.41% | 13,380 | 3.7% |
[ 9.5% - 10.0% ] 9.70% | 21,015 | 4.9% |
[ 9.5% - 10.0% ] 9.97% | 17,681 | 6.9% |
[ 10.0% - 10.5% ] 10.34% | 22,917 | 5.8% |
[ 10.5% - 11.0% ] 10.61% | 7,378 | 6.7% |
[ 10.5% - 11.0% ] 10.97% | 34,297 | 3.7% |
[ 11.0% - 11.5% ] 11.27% | 25,051 | 3.9% |
[ 11.5% - 12.0% ] 11.54% | 9,281 | 6.1% |
[ 11.5% - 12.0% ] 11.86% | 5,879 | 4.9% |
[ 12.0% - 12.5% ] 12.20% | 13,857 | 2.7% |
[ 12.5% - 13.0% ] 12.50% | 4,775 | 3.9% |
[ 12.5% - 13.0% ] 12.76% | 6,428 | 2.4% |
[ 13.0% - 13.5% ] 13.13% | 4,319 | 9.7% |
[ 13.0% - 13.5% ] 13.49% | 11,931 | 2.3% |
[ 13.5% - 14.0% ] 13.88% | 533 | 11.6% |
[ 13.5% - 14.0% ] 13.99% | 25,823 | 2.1% |
[ 14.0% - 14.5% ] 14.43% | 9,029 | 3.7% |
[ 14.5% - 15.0% ] 14.74% | 5,592 | 3.2% |
[ 15.0% - 15.5% ] 15.05% | 12,268 | 5.8% |
[ 15.0% - 15.5% ] 15.22% | 3,134 | 3.0% |
[ 15.5% - 16.0% ] 15.60% | 18,074 | 9.0% |
[ 15.5% - 16.0% ] 15.85% | 3,288 | 12.2% |
[ 16.0% - 16.5% ] 16.06% | 965 | 6.4% |
[ 16.0% - 16.5% ] 16.43% | 986 | 16.0% |
[ 16.5% - 17.0% ] 16.87% | 4,137 | 3.4% |
[ 17.0% - 17.5% ] 17.28% | 5,005 | 3.1% |
[ 17.0% - 17.5% ] 17.39% | 742 | 2.5% |
[ 17.5% - 18.0% ] 17.69% | 3,794 | 6.9% |
[ 18.0% - 18.5% ] 18.05% | 6,636 | 5.2% |
[ 18.0% - 18.5% ] 18.33% | 6,302 | 7.3% |
[ 18.5% - 19.0% ] 18.62% | 1,391 | 3.3% |
[ 19.0% - 19.5% ] 19.07% | 215 | 16.2% |
[ 19.0% - 19.5% ] 19.32% | 1,962 | 6.0% |
[ 19.5% - 20.0% ] 19.56% | 1,953 | 2.5% |
[ 20.0% - 20.5% ] 20.22% | 1,731 | 6.6% |
[ 20.0% - 20.5% ] 20.49% | 6,831 | 2.5% |
[ 21.0% - 21.5% ] 21.17% | 2,475 | 3.7% |
[ 21.5% - 22.0% ] 21.66% | 2,105 | 0.73% |
[ 22.0% - 22.5% ] 22.11% | 484 | 4.2% |
[ 22.0% - 22.5% ] 22.28% | 6,660 | 1.5% |
[ 23.0% - 23.5% ] 23.29% | 73 | 18.2% |
[ 23.5% - 24.0% ] 23.55% | 8,723 | 3.8% |
[ 24.0% - 24.5% ] 24.12% | 170 | 27.6% |
[ 24.5% - 25.0% ] 24.62% | 1,332 | 1.9% |
[ 24.5% - 25.0% ] 24.80% | 254 | 18.7% |
[ 25.0% - 25.5% ] 25.21% | 3,340 | 2.6% |
[ 25.5% - 26.0% ] 25.84% | 1,676 | 4.2% |
[ 27.5% - 28.0% ] 27.72% | 2,244 | 4.8% |
[ 28.5% - 29.0% ] 28.51% | 7,766 | 5.1% |
[ 29.5% - 30.0% ] 29.76% | 1,929 | 3.2% |
[ 30.0% - 30.5% ] 30.19% | 4,942 | 6.4% |
[ 30.0% - 30.5% ] 30.38% | 609 | 3.4% |
[ 30.5% - 31.0% ] 30.79% | 906 | 3.3% |
[ 31.0% - 31.5% ] 31.39% | 223 | 19.6% |
[ 31.5% - 32.0% ] 31.65% | 79 | 9.1% |
[ 32.5% - 33.0% ] 32.94% | 513 | 2.1% |
[ 33.0% - 33.5% ] 33.33% | 183 | 5.9% |
[ 33.0% - 33.5% ] 33.48% | 1,643 | 7.1% |
[ 33.5% - 34.0% ] 33.71% | 5,443 | 2.6% |
[ 34.0% - 34.5% ] 34.31% | 204 | 4.4% |
[ 35.5% - 36.0% ] 35.60% | 663 | 3.8% |
[ 37.0% - 37.5% ] 37.03% | 1,345 | 4.4% |
[ 37.0% - 37.5% ] 37.45% | 275 | 7.7% |
[ 39.0% - 39.5% ] 39.14% | 350 | 1.1% |
[ 40.5% - 41.0% ] 40.59% | 2,237 | 1.2% |
[ 40.5% - 41.0% ] 40.87% | 115 | 19.0% |
[ 42.0% - 42.5% ] 42.07% | 290 | 2.4% |
[ 43.5% - 44.0% ] 43.86% | 342 | 1.4% |
[ 45.0% - 45.5% ] 45.29% | 616 | 0.69% |
[ 45.5% - 46.0% ] 45.90% | 61 | 16.7% |
[ 46.5% - 47.0% ] 46.81% | 376 | 2.0% |
[ 49.5% - 50.0% ] 49.54% | 109 | 7.1% |
[ 52.5% - 53.0% ] 52.57% | 253 | 1.6% |
[ 56.0% - 56.5% ] 56.39% | 454 | 3.9% |
[ 60.5% - 61.0% ] 60.90% | 335 | 3.2% |