Immigrants from Cameroon Married-Couple Family Poverty
COMPARE
Immigrants from Cameroon
Select to Compare
Married-Couple Family Poverty
Immigrants from Cameroon Married-Couple Family Poverty
5.0%
POVERTY | MARRIED-COUPLE FAMILIES
77.3/ 100
METRIC RATING
151st/ 347
METRIC RANK
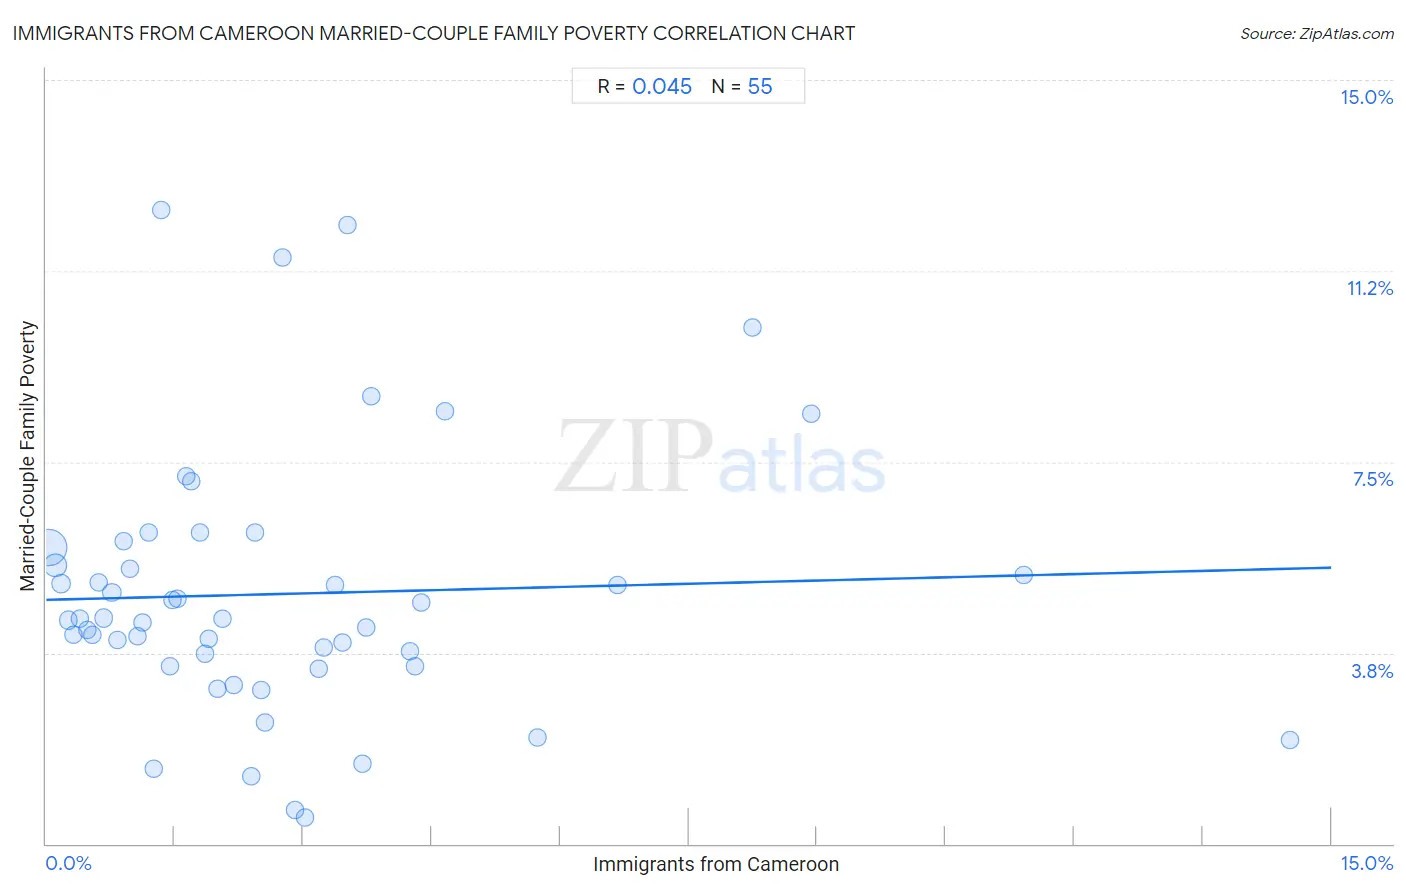
Immigrants from Cameroon Married-Couple Family Poverty Correlation Chart
The statistical analysis conducted on geographies consisting of 130,410,989 people shows no correlation between the proportion of Immigrants from Cameroon and poverty level among married-couple families in the United States with a correlation coefficient (R) of 0.045 and weighted average of 5.0%. On average, for every 1% (one percent) increase in Immigrants from Cameroon within a typical geography, there is an increase of 0.042% in poverty level among married-couple families.
It is essential to understand that the correlation between the percentage of Immigrants from Cameroon and poverty level among married-couple families does not imply a direct cause-and-effect relationship. It remains uncertain whether the presence of Immigrants from Cameroon influences an upward or downward trend in the level of poverty level among married-couple families within an area, or if Immigrants from Cameroon simply ended up residing in those areas with higher or lower levels of poverty level among married-couple families due to other factors.
Demographics Similar to Immigrants from Cameroon by Married-Couple Family Poverty
In terms of married-couple family poverty, the demographic groups most similar to Immigrants from Cameroon are Albanian (5.0%, a difference of 0.010%), Immigrants from Kuwait (5.0%, a difference of 0.16%), Brazilian (5.0%, a difference of 0.17%), Immigrants from Oceania (5.0%, a difference of 0.23%), and Syrian (5.0%, a difference of 0.25%).
| Demographics | Rating | Rank | Married-Couple Family Poverty |
| Hmong | 83.2 /100 | #144 | Excellent 5.0% |
| Immigrants from Spain | 79.9 /100 | #145 | Good 5.0% |
| Mongolians | 79.8 /100 | #146 | Good 5.0% |
| Syrians | 78.7 /100 | #147 | Good 5.0% |
| Immigrants from Russia | 78.7 /100 | #148 | Good 5.0% |
| Immigrants from Oceania | 78.6 /100 | #149 | Good 5.0% |
| Brazilians | 78.3 /100 | #150 | Good 5.0% |
| Immigrants from Cameroon | 77.3 /100 | #151 | Good 5.0% |
| Albanians | 77.2 /100 | #152 | Good 5.0% |
| Immigrants from Kuwait | 76.3 /100 | #153 | Good 5.0% |
| Delaware | 73.7 /100 | #154 | Good 5.1% |
| Immigrants from Ethiopia | 72.4 /100 | #155 | Good 5.1% |
| Sri Lankans | 72.2 /100 | #156 | Good 5.1% |
| Argentineans | 70.7 /100 | #157 | Good 5.1% |
| Immigrants from South Eastern Asia | 70.4 /100 | #158 | Good 5.1% |
Immigrants from Cameroon Married-Couple Family Poverty Correlation Summary
| Measurement | Immigrants from Cameroon Data | Married-Couple Family Poverty Data |
| Minimum | 0.024% | 0.51% |
| Maximum | 14.5% | 12.4% |
| Range | 14.5% | 11.9% |
| Mean | 2.8% | 4.9% |
| Median | 2.0% | 4.4% |
| Interquartile 25% (IQ1) | 0.97% | 3.5% |
| Interquartile 75% (IQ3) | 3.5% | 5.8% |
| Interquartile Range (IQR) | 2.6% | 2.3% |
| Standard Deviation (Sample) | 2.8% | 2.6% |
| Standard Deviation (Population) | 2.8% | 2.6% |
Correlation Details
| Immigrants from Cameroon Percentile | Sample Size | Married-Couple Family Poverty |
[ 0.0% - 0.5% ] 0.024% | 87,859,403 | 5.8% |
[ 0.0% - 0.5% ] 0.11% | 20,415,873 | 5.5% |
[ 0.0% - 0.5% ] 0.18% | 7,197,806 | 5.1% |
[ 0.0% - 0.5% ] 0.26% | 4,049,577 | 4.4% |
[ 0.0% - 0.5% ] 0.32% | 2,542,239 | 4.1% |
[ 0.0% - 0.5% ] 0.39% | 1,396,422 | 4.4% |
[ 0.0% - 0.5% ] 0.48% | 1,120,878 | 4.2% |
[ 0.5% - 1.0% ] 0.54% | 1,338,532 | 4.1% |
[ 0.5% - 1.0% ] 0.61% | 891,702 | 5.1% |
[ 0.5% - 1.0% ] 0.67% | 468,871 | 4.4% |
[ 0.5% - 1.0% ] 0.77% | 323,764 | 4.9% |
[ 0.5% - 1.0% ] 0.83% | 374,821 | 4.0% |
[ 0.5% - 1.0% ] 0.90% | 395,895 | 6.0% |
[ 0.5% - 1.0% ] 0.97% | 242,992 | 5.4% |
[ 1.0% - 1.5% ] 1.07% | 162,614 | 4.1% |
[ 1.0% - 1.5% ] 1.12% | 111,343 | 4.3% |
[ 1.0% - 1.5% ] 1.19% | 233,873 | 6.1% |
[ 1.0% - 1.5% ] 1.26% | 32,848 | 1.5% |
[ 1.0% - 1.5% ] 1.34% | 132,721 | 12.4% |
[ 1.0% - 1.5% ] 1.44% | 73,432 | 3.5% |
[ 1.0% - 1.5% ] 1.47% | 23,239 | 4.8% |
[ 1.5% - 2.0% ] 1.54% | 17,313 | 4.8% |
[ 1.5% - 2.0% ] 1.63% | 133,908 | 7.2% |
[ 1.5% - 2.0% ] 1.69% | 58,835 | 7.1% |
[ 1.5% - 2.0% ] 1.79% | 33,476 | 6.1% |
[ 1.5% - 2.0% ] 1.85% | 156,126 | 3.7% |
[ 1.5% - 2.0% ] 1.90% | 1,105 | 4.0% |
[ 1.5% - 2.0% ] 2.00% | 59,379 | 3.1% |
[ 2.0% - 2.5% ] 2.05% | 37,627 | 4.4% |
[ 2.0% - 2.5% ] 2.19% | 6,341 | 3.1% |
[ 2.0% - 2.5% ] 2.39% | 30,785 | 1.3% |
[ 2.0% - 2.5% ] 2.44% | 49,658 | 6.1% |
[ 2.5% - 3.0% ] 2.51% | 2,034 | 3.0% |
[ 2.5% - 3.0% ] 2.55% | 20,833 | 2.4% |
[ 2.5% - 3.0% ] 2.75% | 1,490 | 11.5% |
[ 2.5% - 3.0% ] 2.90% | 26,253 | 0.67% |
[ 3.0% - 3.5% ] 3.02% | 12,103 | 0.51% |
[ 3.0% - 3.5% ] 3.18% | 75,901 | 3.4% |
[ 3.0% - 3.5% ] 3.23% | 54,445 | 3.8% |
[ 3.0% - 3.5% ] 3.37% | 6,638 | 5.1% |
[ 3.0% - 3.5% ] 3.46% | 11,662 | 3.9% |
[ 3.5% - 4.0% ] 3.52% | 8,290 | 12.2% |
[ 3.5% - 4.0% ] 3.69% | 2,330 | 1.6% |
[ 3.5% - 4.0% ] 3.73% | 24,646 | 4.3% |
[ 3.5% - 4.0% ] 3.79% | 12,128 | 8.8% |
[ 4.0% - 4.5% ] 4.24% | 75,988 | 3.8% |
[ 4.0% - 4.5% ] 4.30% | 28,427 | 3.5% |
[ 4.0% - 4.5% ] 4.38% | 27,909 | 4.7% |
[ 4.5% - 5.0% ] 4.65% | 16,944 | 8.5% |
[ 5.5% - 6.0% ] 5.73% | 5,041 | 2.1% |
[ 6.5% - 7.0% ] 6.67% | 2,699 | 5.1% |
[ 8.0% - 8.5% ] 8.24% | 15,489 | 10.1% |
[ 8.5% - 9.0% ] 8.92% | 3,104 | 8.4% |
[ 11.0% - 11.5% ] 11.42% | 1,997 | 5.3% |
[ 14.5% - 15.0% ] 14.52% | 1,240 | 2.0% |