Immigrants from Argentina Married-Couple Family Poverty
COMPARE
Immigrants from Argentina
Select to Compare
Married-Couple Family Poverty
Immigrants from Argentina Married-Couple Family Poverty
5.2%
POVERTY | MARRIED-COUPLE FAMILIES
54.4/ 100
METRIC RATING
170th/ 347
METRIC RANK
Immigrants from Argentina Married-Couple Family Poverty Correlation Chart
The statistical analysis conducted on geographies consisting of 263,243,889 people shows a poor positive correlation between the proportion of Immigrants from Argentina and poverty level among married-couple families in the United States with a correlation coefficient (R) of 0.160 and weighted average of 5.2%. On average, for every 1% (one percent) increase in Immigrants from Argentina within a typical geography, there is an increase of 0.22% in poverty level among married-couple families.
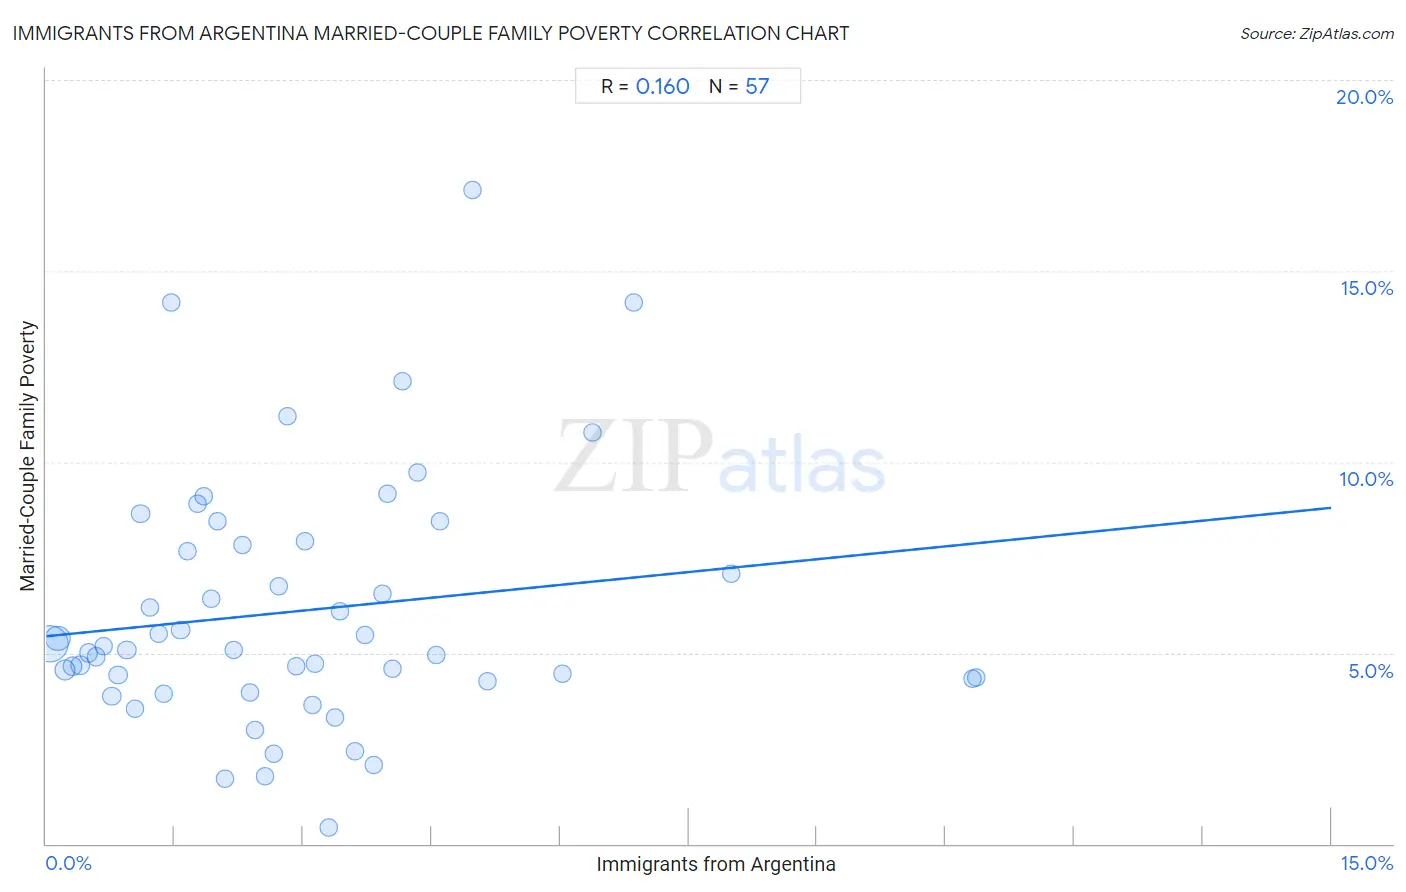
It is essential to understand that the correlation between the percentage of Immigrants from Argentina and poverty level among married-couple families does not imply a direct cause-and-effect relationship. It remains uncertain whether the presence of Immigrants from Argentina influences an upward or downward trend in the level of poverty level among married-couple families within an area, or if Immigrants from Argentina simply ended up residing in those areas with higher or lower levels of poverty level among married-couple families due to other factors.
Demographics Similar to Immigrants from Argentina by Married-Couple Family Poverty
In terms of married-couple family poverty, the demographic groups most similar to Immigrants from Argentina are Ottawa (5.2%, a difference of 0.010%), Immigrants from Uganda (5.2%, a difference of 0.060%), Bermudan (5.2%, a difference of 0.18%), Immigrants from Northern Africa (5.2%, a difference of 0.35%), and Alsatian (5.2%, a difference of 0.37%).
| Demographics | Rating | Rank | Married-Couple Family Poverty |
| Sierra Leoneans | 64.1 /100 | #163 | Good 5.1% |
| Hawaiians | 62.3 /100 | #164 | Good 5.1% |
| Immigrants from Malaysia | 62.2 /100 | #165 | Good 5.1% |
| Paraguayans | 61.5 /100 | #166 | Good 5.1% |
| Costa Ricans | 61.5 /100 | #167 | Good 5.1% |
| Immigrants from Uganda | 54.9 /100 | #168 | Average 5.2% |
| Ottawa | 54.5 /100 | #169 | Average 5.2% |
| Immigrants from Argentina | 54.4 /100 | #170 | Average 5.2% |
| Bermudans | 52.9 /100 | #171 | Average 5.2% |
| Immigrants from Northern Africa | 51.3 /100 | #172 | Average 5.2% |
| Alsatians | 51.2 /100 | #173 | Average 5.2% |
| Immigrants from Eastern Africa | 50.0 /100 | #174 | Average 5.2% |
| Marshallese | 47.9 /100 | #175 | Average 5.2% |
| Menominee | 47.8 /100 | #176 | Average 5.2% |
| Immigrants from Kazakhstan | 45.1 /100 | #177 | Average 5.2% |
Immigrants from Argentina Married-Couple Family Poverty Correlation Summary
| Measurement | Immigrants from Argentina Data | Married-Couple Family Poverty Data |
| Minimum | 0.040% | 0.43% |
| Maximum | 10.9% | 17.1% |
| Range | 10.8% | 16.7% |
| Mean | 2.9% | 6.1% |
| Median | 2.6% | 5.1% |
| Interquartile 25% (IQ1) | 1.3% | 4.3% |
| Interquartile 75% (IQ3) | 4.0% | 7.9% |
| Interquartile Range (IQR) | 2.7% | 3.6% |
| Standard Deviation (Sample) | 2.3% | 3.3% |
| Standard Deviation (Population) | 2.3% | 3.2% |
Correlation Details
| Immigrants from Argentina Percentile | Sample Size | Married-Couple Family Poverty |
[ 0.0% - 0.5% ] 0.040% | 155,384,384 | 5.2% |
[ 0.0% - 0.5% ] 0.13% | 57,920,033 | 5.4% |
[ 0.0% - 0.5% ] 0.22% | 20,156,524 | 4.5% |
[ 0.0% - 0.5% ] 0.31% | 10,301,708 | 4.7% |
[ 0.0% - 0.5% ] 0.40% | 6,684,201 | 4.7% |
[ 0.0% - 0.5% ] 0.49% | 3,349,000 | 5.0% |
[ 0.5% - 1.0% ] 0.58% | 2,046,472 | 4.9% |
[ 0.5% - 1.0% ] 0.67% | 1,535,662 | 5.2% |
[ 0.5% - 1.0% ] 0.77% | 849,799 | 3.9% |
[ 0.5% - 1.0% ] 0.84% | 653,660 | 4.4% |
[ 0.5% - 1.0% ] 0.94% | 772,305 | 5.1% |
[ 1.0% - 1.5% ] 1.03% | 350,715 | 3.5% |
[ 1.0% - 1.5% ] 1.10% | 751,550 | 8.7% |
[ 1.0% - 1.5% ] 1.21% | 452,087 | 6.2% |
[ 1.0% - 1.5% ] 1.31% | 321,186 | 5.5% |
[ 1.0% - 1.5% ] 1.38% | 37,985 | 3.9% |
[ 1.0% - 1.5% ] 1.46% | 33,585 | 14.2% |
[ 1.5% - 2.0% ] 1.57% | 227,295 | 5.6% |
[ 1.5% - 2.0% ] 1.65% | 312,525 | 7.7% |
[ 1.5% - 2.0% ] 1.77% | 10,796 | 8.9% |
[ 1.5% - 2.0% ] 1.84% | 97,718 | 9.1% |
[ 1.5% - 2.0% ] 1.93% | 78,170 | 6.4% |
[ 1.5% - 2.0% ] 2.00% | 88,709 | 8.4% |
[ 2.0% - 2.5% ] 2.09% | 25,560 | 1.7% |
[ 2.0% - 2.5% ] 2.19% | 58,423 | 5.1% |
[ 2.0% - 2.5% ] 2.29% | 42,320 | 7.8% |
[ 2.0% - 2.5% ] 2.38% | 25,783 | 3.9% |
[ 2.0% - 2.5% ] 2.44% | 9,891 | 3.0% |
[ 2.5% - 3.0% ] 2.56% | 26,814 | 1.8% |
[ 2.5% - 3.0% ] 2.66% | 15,322 | 2.4% |
[ 2.5% - 3.0% ] 2.72% | 54,981 | 6.7% |
[ 2.5% - 3.0% ] 2.82% | 2,414 | 11.2% |
[ 2.5% - 3.0% ] 2.92% | 116,225 | 4.6% |
[ 3.0% - 3.5% ] 3.02% | 44,914 | 7.9% |
[ 3.0% - 3.5% ] 3.11% | 546 | 3.6% |
[ 3.0% - 3.5% ] 3.14% | 46,704 | 4.7% |
[ 3.0% - 3.5% ] 3.29% | 6,952 | 0.43% |
[ 3.0% - 3.5% ] 3.36% | 7,016 | 3.3% |
[ 3.0% - 3.5% ] 3.43% | 42,058 | 6.1% |
[ 3.5% - 4.0% ] 3.61% | 721 | 2.4% |
[ 3.5% - 4.0% ] 3.71% | 36,324 | 5.5% |
[ 3.5% - 4.0% ] 3.83% | 26,436 | 2.1% |
[ 3.5% - 4.0% ] 3.93% | 22,202 | 6.5% |
[ 3.5% - 4.0% ] 3.98% | 5,625 | 9.2% |
[ 4.0% - 4.5% ] 4.04% | 23,734 | 4.6% |
[ 4.0% - 4.5% ] 4.15% | 289 | 12.1% |
[ 4.0% - 4.5% ] 4.33% | 1,640 | 9.7% |
[ 4.5% - 5.0% ] 4.55% | 82,400 | 5.0% |
[ 4.5% - 5.0% ] 4.60% | 16,450 | 8.4% |
[ 4.5% - 5.0% ] 4.97% | 3,098 | 17.1% |
[ 5.0% - 5.5% ] 5.15% | 7,800 | 4.3% |
[ 6.0% - 6.5% ] 6.03% | 35,967 | 4.5% |
[ 6.0% - 6.5% ] 6.37% | 1,381 | 10.8% |
[ 6.5% - 7.0% ] 6.85% | 3,589 | 14.2% |
[ 7.5% - 8.0% ] 7.99% | 5,030 | 7.1% |
[ 10.5% - 11.0% ] 10.81% | 14,639 | 4.3% |
[ 10.5% - 11.0% ] 10.86% | 14,572 | 4.3% |