Barbadian Married-Couple Family Poverty

COMPARE

Barbadian
Race
Ancestry
AfghanAfricanAlaska NativeAlaskan AthabascanAlbanianAleutAlsatianAmericanApacheArabArapahoArgentineanArmenianAssyrian/Chaldean/SyriacAustralianAustrianBahamianBangladeshiBarbadianBasqueBelgianBelizeanBermudanBhutaneseBlackfeetBolivianBrazilianBritishBritish West IndianBulgarianBurmeseCajunCambodianCanadianCape VerdeanCarpatho RusynCelticCentral AmericanCentral American IndianCherokeeCheyenneChickasawChileanChineseChippewaChoctawColombianColvilleComancheCosta RicanCreeCreekCroatianCrowCubanCypriotCzechCzechoslovakianDanishDelawareDominicanDutchDutch West IndianEastern EuropeanEcuadorianEgyptianEnglishEstonianEthiopianEuropeanFijianFilipinoFinnishFrenchFrench American IndianFrench CanadianGermanGerman RussianGhanaianGreekGuamanian/ChamorroGuatemalanGuyaneseHaitianHmongHonduranHopiHoumaHungarianIcelanderIndian (Asian)IndonesianInupiatIranianIraqiIrishIroquoisIsraeliItalianJamaicanJapaneseJordanianKenyanKiowaKoreanLaotianLatvianLebaneseLiberianLithuanianLumbeeLuxembourgerMacedonianMalaysianMalteseMarshalleseMenomineeMexicanMexican American IndianMongolianMoroccanNative HawaiianNavajoNepaleseNew ZealanderNicaraguanNigerianNorthern EuropeanNorwegianOkinawanOsageOttawaPaiutePakistaniPalestinianPanamanianParaguayanPennsylvania GermanPeruvianPimaPolishPortuguesePotawatomiPuebloPuerto RicanPuget Sound SalishRomanianRussianSalvadoranSamoanScandinavianScotch-IrishScottishSeminoleSenegaleseSerbianShoshoneSierra LeoneanSiouxSlavicSlovakSloveneSomaliSouth AfricanSouth AmericanSouth American IndianSoviet UnionSpaniardSpanishSpanish AmericanSpanish American IndianSri LankanSubsaharan AfricanSudaneseSwedishSwissSyrianTaiwaneseThaiTlingit-HaidaTohono O'OdhamTonganTrinidadian and TobagonianTsimshianTurkishU.S. Virgin IslanderUgandanUkrainianUruguayanUteVenezuelanVietnameseWelshWest IndianYakamaYaquiYugoslavianYumanYup'ikZimbabwean
Immigration
NonimmigrantsImmigrantsAfghanistanAfricaAlbaniaArgentinaArmeniaAsiaAustraliaAustriaBahamasBangladeshBarbadosBelarusBelgiumBelizeBoliviaBosnia and HerzegovinaBrazilBulgariaBurma/MyanmarCabo VerdeCambodiaCameroonCanadaCaribbeanCentral AmericaChileChinaColombiaCongoCosta RicaCroatiaCubaCzechoslovakiaDenmarkDominicaDominican RepublicEastern AfricaEastern AsiaEastern EuropeEcuadorEgyptEl SalvadorEnglandEritreaEthiopiaEuropeFijiFranceGermanyGhanaGreeceGrenadaGuatemalaGuyanaHaitiHondurasHong KongHungaryIndiaIndonesiaIranIraqIrelandIsraelItalyJamaicaJapanJordanKazakhstanKenyaKoreaKuwaitLaosLatin AmericaLatviaLebanonLiberiaLithuaniaMalaysiaMexicoMicronesiaMiddle AfricaMoldovaMoroccoNepalNetherlandsNicaraguaNigeriaNorth AmericaNorth MacedoniaNorthern AfricaNorthern EuropeNorwayOceaniaPakistanPanamaPeruPhilippinesPolandPortugalRomaniaRussiaSaudi ArabiaScotlandSenegalSerbiaSierra LeoneSingaporeSomaliaSouth AfricaSouth AmericaSouth Central AsiaSouth Eastern AsiaSouthern EuropeSpainSri LankaSt. Vincent and the GrenadinesSudanSwedenSwitzerlandSyriaTaiwanThailandTrinidad and TobagoTurkeyUgandaUkraineUruguayUzbekistanVenezuelaVietnamWest IndiesWestern AfricaWestern AsiaWestern EuropeYemenZaireZimbabweAzores
Select to Compare
Race
Ancestry
AfghanAfricanAlaska NativeAlaskan AthabascanAlbanianAleutAlsatianAmericanApacheArabArapahoArgentineanArmenianAssyrian/Chaldean/SyriacAustralianAustrianBahamianBangladeshiBasqueBelgianBelizeanBermudanBhutaneseBlackfeetBolivianBrazilianBritishBritish West IndianBulgarianBurmeseCajunCambodianCanadianCape VerdeanCarpatho RusynCelticCentral AmericanCentral American IndianCherokeeCheyenneChickasawChileanChineseChippewaChoctawColombianColvilleComancheCosta RicanCreeCreekCroatianCrowCubanCypriotCzechCzechoslovakianDanishDelawareDominicanDutchDutch West IndianEastern EuropeanEcuadorianEgyptianEnglishEstonianEthiopianEuropeanFijianFilipinoFinnishFrenchFrench American IndianFrench CanadianGermanGerman RussianGhanaianGreekGuamanian/ChamorroGuatemalanGuyaneseHaitianHmongHonduranHopiHoumaHungarianIcelanderIndian (Asian)IndonesianInupiatIranianIraqiIrishIroquoisIsraeliItalianJamaicanJapaneseJordanianKenyanKiowaKoreanLaotianLatvianLebaneseLiberianLithuanianLumbeeLuxembourgerMacedonianMalaysianMalteseMarshalleseMenomineeMexicanMexican American IndianMongolianMoroccanNative HawaiianNavajoNepaleseNew ZealanderNicaraguanNigerianNorthern EuropeanNorwegianOkinawanOsageOttawaPaiutePakistaniPalestinianPanamanianParaguayanPennsylvania GermanPeruvianPimaPolishPortuguesePotawatomiPuebloPuerto RicanPuget Sound SalishRomanianRussianSalvadoranSamoanScandinavianScotch-IrishScottishSeminoleSenegaleseSerbianShoshoneSierra LeoneanSiouxSlavicSlovakSloveneSomaliSouth AfricanSouth AmericanSouth American IndianSoviet UnionSpaniardSpanishSpanish AmericanSpanish American IndianSri LankanSubsaharan AfricanSudaneseSwedishSwissSyrianTaiwaneseThaiTlingit-HaidaTohono O'OdhamTonganTrinidadian and TobagonianTsimshianTurkishU.S. Virgin IslanderUgandanUkrainianUruguayanUteVenezuelanVietnameseWelshWest IndianYakamaYaquiYugoslavianYumanYup'ikZimbabwean
Immigration
NonimmigrantsImmigrantsAfghanistanAfricaAlbaniaArgentinaArmeniaAsiaAustraliaAustriaBahamasBangladeshBarbadosBelarusBelgiumBelizeBoliviaBosnia and HerzegovinaBrazilBulgariaBurma/MyanmarCabo VerdeCambodiaCameroonCanadaCaribbeanCentral AmericaChileChinaColombiaCongoCosta RicaCroatiaCubaCzechoslovakiaDenmarkDominicaDominican RepublicEastern AfricaEastern AsiaEastern EuropeEcuadorEgyptEl SalvadorEnglandEritreaEthiopiaEuropeFijiFranceGermanyGhanaGreeceGrenadaGuatemalaGuyanaHaitiHondurasHong KongHungaryIndiaIndonesiaIranIraqIrelandIsraelItalyJamaicaJapanJordanKazakhstanKenyaKoreaKuwaitLaosLatin AmericaLatviaLebanonLiberiaLithuaniaMalaysiaMexicoMicronesiaMiddle AfricaMoldovaMoroccoNepalNetherlandsNicaraguaNigeriaNorth AmericaNorth MacedoniaNorthern AfricaNorthern EuropeNorwayOceaniaPakistanPanamaPeruPhilippinesPolandPortugalRomaniaRussiaSaudi ArabiaScotlandSenegalSerbiaSierra LeoneSingaporeSomaliaSouth AfricaSouth AmericaSouth Central AsiaSouth Eastern AsiaSouthern EuropeSpainSri LankaSt. Vincent and the GrenadinesSudanSwedenSwitzerlandSyriaTaiwanThailandTrinidad and TobagoTurkeyUgandaUkraineUruguayUzbekistanVenezuelaVietnamWest IndiesWestern AfricaWestern AsiaWestern EuropeYemenZaireZimbabweAzores
Married-Couple Family Poverty
Income
Poverty
Unemployment
Labor Participation
Family Structure
Vehicle Availability
Education Level
Disability

Barbadian Married-Couple Family Poverty
Tragic

6.3%
POVERTY | MARRIED-COUPLE FAMILIES
0.1/ 100
METRIC RATING
274th/ 347
METRIC RANK

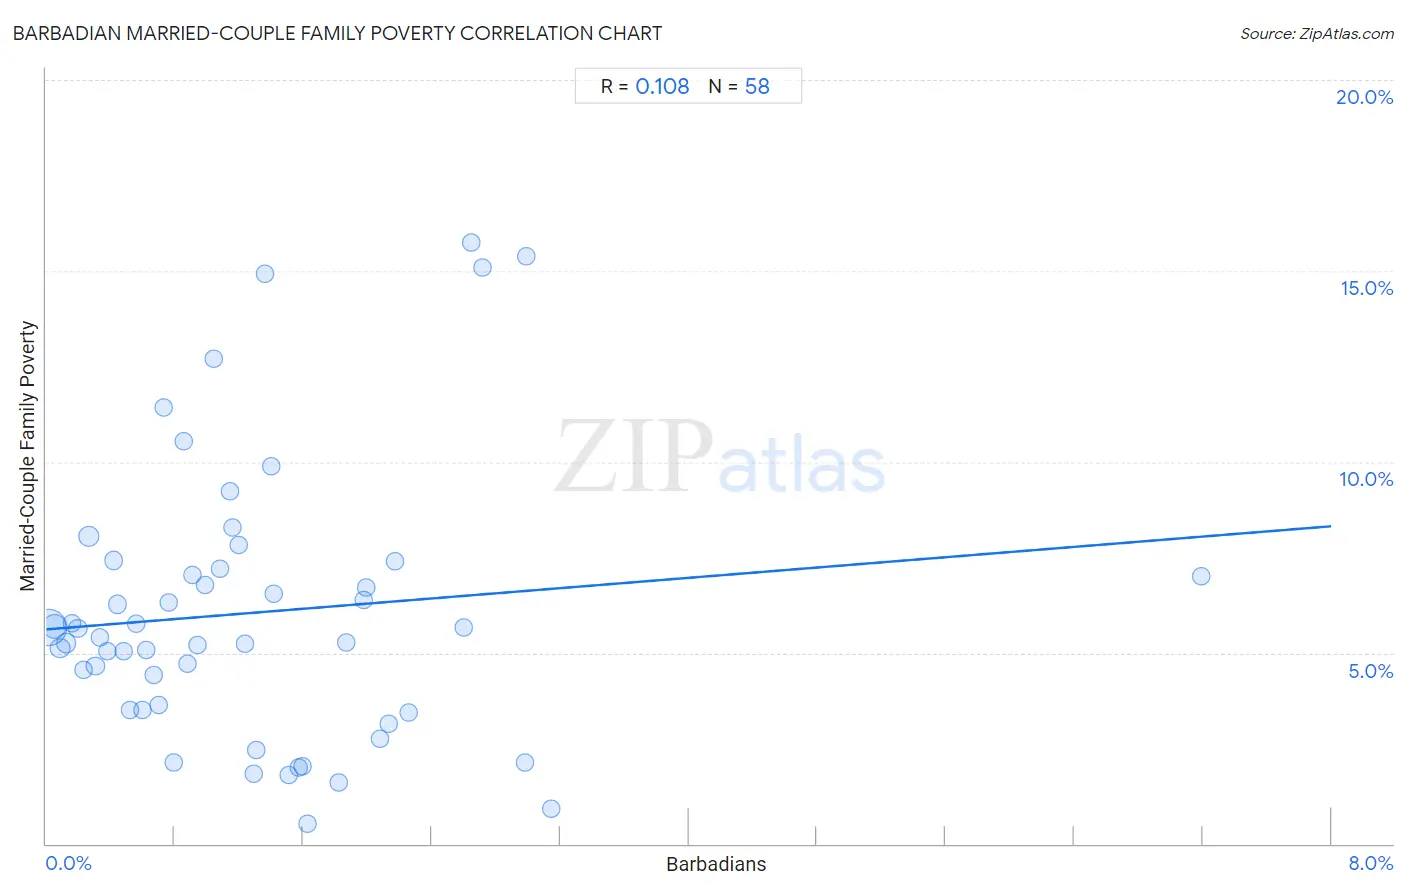
Barbadian Married-Couple Family Poverty Correlation Chart

The statistical analysis conducted on geographies consisting of 140,986,203 people shows a poor positive correlation between the proportion of Barbadians and poverty level among married-couple families in the United States with a correlation coefficient (R) of 0.108 and weighted average of 6.3%. On average, for every 1% (one percent) increase in Barbadians within a typical geography, there is an increase of 0.34% in poverty level among married-couple families.
Barbadian Married-Couple Family Poverty
It is essential to understand that the correlation between the percentage of Barbadians and poverty level among married-couple families does not imply a direct cause-and-effect relationship. It remains uncertain whether the presence of Barbadians influences an upward or downward trend in the level of poverty level among married-couple families within an area, or if Barbadians simply ended up residing in those areas with higher or lower levels of poverty level among married-couple families due to other factors.

Demographics Similar to Barbadians by Married-Couple Family Poverty

In terms of married-couple family poverty, the demographic groups most similar to Barbadians are Colville (6.3%, a difference of 0.050%), Choctaw (6.3%, a difference of 0.16%), Yaqui (6.3%, a difference of 0.62%), Indonesian (6.3%, a difference of 0.75%), and Trinidadian and Tobagonian (6.2%, a difference of 0.83%).
DemographicsRating | RankMarried-Couple Family Poverty
Spanish Americans
0.2
/100
|
#267
Tragic
6.2%
Alaska Natives
0.2
/100
|
#268
Tragic
6.2%
Immigrants from West Indies
0.1
/100
|
#269
Tragic
6.2%
Immigrants from Jamaica
0.1
/100
|
#270
Tragic
6.2%
Immigrants from Bahamas
0.1
/100
|
#271
Tragic
6.2%
Trinidadians and Tobagonians
0.1
/100
|
#272
Tragic
6.2%
Colville
0.1
/100
|
#273
Tragic
6.3%
Barbadians
0.1
/100
|
#274
Tragic
6.3%
Choctaw
0.1
/100
|
#275
Tragic
6.3%
Yaqui
0.1
/100
|
#276
Tragic
6.3%
Indonesians
0.1
/100
|
#277
Tragic
6.3%
Immigrants from Trinidad and Tobago
0.1
/100
|
#278
Tragic
6.4%
Houma
0.0
/100
|
#279
Tragic
6.4%
West Indians
0.0
/100
|
#280
Tragic
6.4%
Mexican American Indians
0.0
/100
|
#281
Tragic
6.4%

Barbadian Married-Couple Family Poverty Correlation Summary

MeasurementBarbadian DataMarried-Couple Family Poverty Data
Minimum0.013%0.52%
Maximum7.2%15.7%
Range7.2%15.2%
Mean1.3%6.0%
Median1.1%5.5%
Interquartile 25% (IQ1)0.52%3.5%
Interquartile 75% (IQ3)1.8%7.2%
Interquartile Range (IQR)1.3%3.7%
Standard Deviation (Sample)1.1%3.6%
Standard Deviation (Population)1.1%3.5%

Correlation Details

Barbadian PercentileSample SizeMarried-Couple Family Poverty
[
0.0%
-
0.5%
]
0.013%
76,131,9475.7%
[
0.0%
-
0.5%
]
0.051%
23,728,9495.7%
[
0.0%
-
0.5%
]
0.089%
9,459,5005.1%
[
0.0%
-
0.5%
]
0.12%
5,872,7135.3%
[
0.0%
-
0.5%
]
0.16%
4,026,0855.8%
[
0.0%
-
0.5%
]
0.20%
2,631,8065.6%
[
0.0%
-
0.5%
]
0.23%
1,444,2214.5%
[
0.0%
-
0.5%
]
0.26%
9,714,0118.0%
[
0.0%
-
0.5%
]
0.31%
1,519,1124.7%
[
0.0%
-
0.5%
]
0.34%
859,5265.4%
[
0.0%
-
0.5%
]
0.38%
529,2535.0%
[
0.0%
-
0.5%
]
0.42%
1,116,4807.4%
[
0.0%
-
0.5%
]
0.44%
412,5866.3%
[
0.0%
-
0.5%
]
0.48%
336,6745.1%
[
0.5%
-
1.0%
]
0.52%
214,5503.5%
[
0.5%
-
1.0%
]
0.56%
406,0155.8%
[
0.5%
-
1.0%
]
0.60%
143,0413.5%
[
0.5%
-
1.0%
]
0.63%
108,9705.1%
[
0.5%
-
1.0%
]
0.67%
29,9924.4%
[
0.5%
-
1.0%
]
0.70%
220,6803.6%
[
0.5%
-
1.0%
]
0.73%
231,40911.4%
[
0.5%
-
1.0%
]
0.77%
170,0026.3%
[
0.5%
-
1.0%
]
0.80%
6,6602.1%
[
0.5%
-
1.0%
]
0.85%
165,28310.6%
[
0.5%
-
1.0%
]
0.88%
91,4104.7%
[
0.5%
-
1.0%
]
0.91%
308,0047.1%
[
0.5%
-
1.0%
]
0.94%
110,6705.2%
[
0.5%
-
1.0%
]
0.99%
94,0166.8%
[
1.0%
-
1.5%
]
1.05%
31,73012.7%
[
1.0%
-
1.5%
]
1.08%
16,9097.2%
[
1.0%
-
1.5%
]
1.14%
1,1389.2%
[
1.0%
-
1.5%
]
1.16%
182,4068.3%
[
1.0%
-
1.5%
]
1.20%
84,4587.8%
[
1.0%
-
1.5%
]
1.24%
36,5195.2%
[
1.0%
-
1.5%
]
1.29%
4,6501.8%
[
1.0%
-
1.5%
]
1.31%
10,5262.5%
[
1.0%
-
1.5%
]
1.36%
69,13114.9%
[
1.0%
-
1.5%
]
1.40%
58,4769.9%
[
1.0%
-
1.5%
]
1.42%
9,2526.5%
[
1.5%
-
2.0%
]
1.51%
1,5901.8%
[
1.5%
-
2.0%
]
1.57%
10,6312.0%
[
1.5%
-
2.0%
]
1.59%
10,4822.0%
[
1.5%
-
2.0%
]
1.63%
22,6200.52%
[
1.5%
-
2.0%
]
1.82%
24,0441.6%
[
1.5%
-
2.0%
]
1.87%
27,5905.3%
[
1.5%
-
2.0%
]
1.97%
78,5066.4%
[
1.5%
-
2.0%
]
1.99%
5536.7%
[
2.0%
-
2.5%
]
2.08%
3,2222.8%
[
2.0%
-
2.5%
]
2.13%
7,4123.1%
[
2.0%
-
2.5%
]
2.17%
55,3367.4%
[
2.0%
-
2.5%
]
2.25%
100,0823.4%
[
2.5%
-
3.0%
]
2.60%
14,1725.7%
[
2.5%
-
3.0%
]
2.64%
5,37315.7%
[
2.5%
-
3.0%
]
2.72%
6,10815.1%
[
2.5%
-
3.0%
]
2.98%
4,7032.1%
[
2.5%
-
3.0%
]
2.99%
13415.4%
[
3.0%
-
3.5%
]
3.14%
23,1190.91%
[
7.0%
-
7.5%
]
7.19%
1,7667.0%