Albanian Married-Couple Family Poverty
COMPARE
Albanian
Select to Compare
Married-Couple Family Poverty
Albanian Married-Couple Family Poverty
5.0%
POVERTY | MARRIED-COUPLE FAMILIES
77.2/ 100
METRIC RATING
152nd/ 347
METRIC RANK
Albanian Married-Couple Family Poverty Correlation Chart
The statistical analysis conducted on geographies consisting of 191,950,147 people shows a slight positive correlation between the proportion of Albanians and poverty level among married-couple families in the United States with a correlation coefficient (R) of 0.091 and weighted average of 5.0%. On average, for every 1% (one percent) increase in Albanians within a typical geography, there is an increase of 0.066% in poverty level among married-couple families.
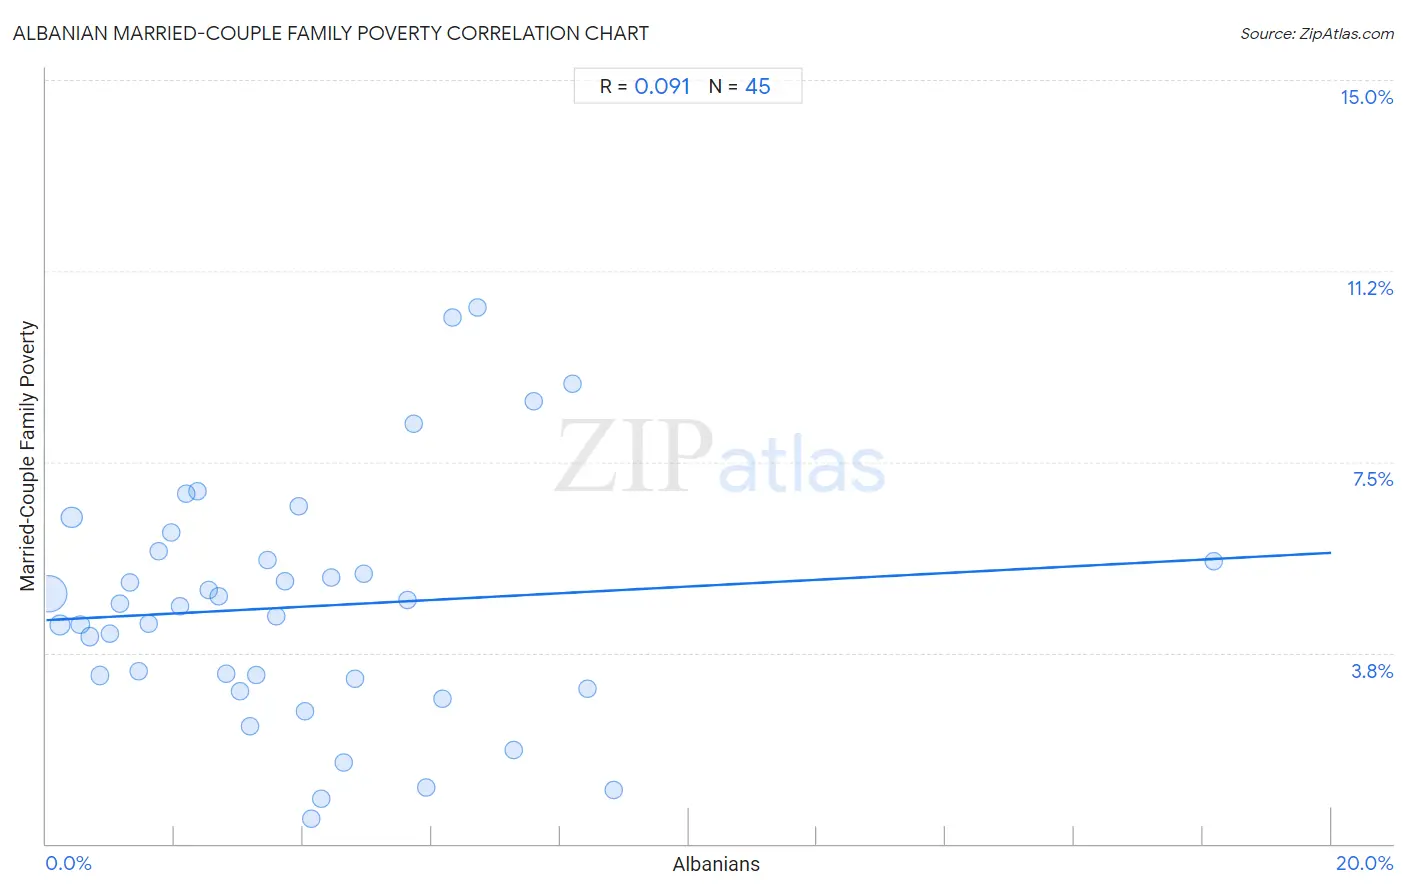
It is essential to understand that the correlation between the percentage of Albanians and poverty level among married-couple families does not imply a direct cause-and-effect relationship. It remains uncertain whether the presence of Albanians influences an upward or downward trend in the level of poverty level among married-couple families within an area, or if Albanians simply ended up residing in those areas with higher or lower levels of poverty level among married-couple families due to other factors.
Demographics Similar to Albanians by Married-Couple Family Poverty
In terms of married-couple family poverty, the demographic groups most similar to Albanians are Immigrants from Cameroon (5.0%, a difference of 0.010%), Immigrants from Kuwait (5.0%, a difference of 0.15%), Brazilian (5.0%, a difference of 0.19%), Immigrants from Oceania (5.0%, a difference of 0.24%), and Immigrants from Russia (5.0%, a difference of 0.26%).
| Demographics | Rating | Rank | Married-Couple Family Poverty |
| Immigrants from Spain | 79.9 /100 | #145 | Good 5.0% |
| Mongolians | 79.8 /100 | #146 | Good 5.0% |
| Syrians | 78.7 /100 | #147 | Good 5.0% |
| Immigrants from Russia | 78.7 /100 | #148 | Good 5.0% |
| Immigrants from Oceania | 78.6 /100 | #149 | Good 5.0% |
| Brazilians | 78.3 /100 | #150 | Good 5.0% |
| Immigrants from Cameroon | 77.3 /100 | #151 | Good 5.0% |
| Albanians | 77.2 /100 | #152 | Good 5.0% |
| Immigrants from Kuwait | 76.3 /100 | #153 | Good 5.0% |
| Delaware | 73.7 /100 | #154 | Good 5.1% |
| Immigrants from Ethiopia | 72.4 /100 | #155 | Good 5.1% |
| Sri Lankans | 72.2 /100 | #156 | Good 5.1% |
| Argentineans | 70.7 /100 | #157 | Good 5.1% |
| Immigrants from South Eastern Asia | 70.4 /100 | #158 | Good 5.1% |
| Immigrants from Saudi Arabia | 70.3 /100 | #159 | Good 5.1% |
Albanian Married-Couple Family Poverty Correlation Summary
| Measurement | Albanian Data | Married-Couple Family Poverty Data |
| Minimum | 0.043% | 0.48% |
| Maximum | 18.2% | 10.5% |
| Range | 18.1% | 10.0% |
| Mean | 4.0% | 4.7% |
| Median | 3.4% | 4.7% |
| Interquartile 25% (IQ1) | 1.7% | 3.2% |
| Interquartile 75% (IQ3) | 5.7% | 5.7% |
| Interquartile Range (IQR) | 4.0% | 2.5% |
| Standard Deviation (Sample) | 3.2% | 2.3% |
| Standard Deviation (Population) | 3.2% | 2.3% |
Correlation Details
| Albanian Percentile | Sample Size | Married-Couple Family Poverty |
[ 0.0% - 0.5% ] 0.043% | 135,759,278 | 4.9% |
[ 0.0% - 0.5% ] 0.21% | 17,839,782 | 4.3% |
[ 0.0% - 0.5% ] 0.40% | 19,941,511 | 6.4% |
[ 0.5% - 1.0% ] 0.53% | 5,003,540 | 4.3% |
[ 0.5% - 1.0% ] 0.68% | 3,362,404 | 4.1% |
[ 0.5% - 1.0% ] 0.84% | 1,686,207 | 3.3% |
[ 0.5% - 1.0% ] 0.99% | 1,331,567 | 4.1% |
[ 1.0% - 1.5% ] 1.14% | 1,316,183 | 4.7% |
[ 1.0% - 1.5% ] 1.30% | 1,026,922 | 5.1% |
[ 1.0% - 1.5% ] 1.44% | 571,634 | 3.4% |
[ 1.5% - 2.0% ] 1.60% | 459,373 | 4.3% |
[ 1.5% - 2.0% ] 1.75% | 731,336 | 5.7% |
[ 1.5% - 2.0% ] 1.95% | 399,743 | 6.1% |
[ 2.0% - 2.5% ] 2.08% | 222,629 | 4.7% |
[ 2.0% - 2.5% ] 2.18% | 492,277 | 6.9% |
[ 2.0% - 2.5% ] 2.36% | 277,968 | 6.9% |
[ 2.5% - 3.0% ] 2.54% | 428,681 | 5.0% |
[ 2.5% - 3.0% ] 2.69% | 141,025 | 4.9% |
[ 2.5% - 3.0% ] 2.80% | 198,349 | 3.3% |
[ 3.0% - 3.5% ] 3.01% | 132,141 | 3.0% |
[ 3.0% - 3.5% ] 3.17% | 71,323 | 2.3% |
[ 3.0% - 3.5% ] 3.26% | 40,703 | 3.3% |
[ 3.0% - 3.5% ] 3.45% | 95,873 | 5.6% |
[ 3.5% - 4.0% ] 3.59% | 93,540 | 4.5% |
[ 3.5% - 4.0% ] 3.72% | 84,414 | 5.2% |
[ 3.5% - 4.0% ] 3.93% | 74,335 | 6.6% |
[ 4.0% - 4.5% ] 4.03% | 8,966 | 2.6% |
[ 4.0% - 4.5% ] 4.12% | 7,282 | 0.48% |
[ 4.0% - 4.5% ] 4.28% | 7,987 | 0.89% |
[ 4.0% - 4.5% ] 4.43% | 33,894 | 5.2% |
[ 4.5% - 5.0% ] 4.63% | 5,209 | 1.6% |
[ 4.5% - 5.0% ] 4.80% | 2,937 | 3.2% |
[ 4.5% - 5.0% ] 4.93% | 30,413 | 5.3% |
[ 5.5% - 6.0% ] 5.63% | 1,350 | 4.8% |
[ 5.5% - 6.0% ] 5.72% | 41,328 | 8.2% |
[ 5.5% - 6.0% ] 5.92% | 7,337 | 1.1% |
[ 6.0% - 6.5% ] 6.17% | 3,304 | 2.8% |
[ 6.0% - 6.5% ] 6.32% | 3,700 | 10.3% |
[ 6.5% - 7.0% ] 6.71% | 164 | 10.5% |
[ 7.0% - 7.5% ] 7.28% | 2,336 | 1.8% |
[ 7.5% - 8.0% ] 7.59% | 369 | 8.7% |
[ 8.0% - 8.5% ] 8.19% | 891 | 9.0% |
[ 8.0% - 8.5% ] 8.41% | 2,353 | 3.1% |
[ 8.5% - 9.0% ] 8.82% | 6,653 | 1.1% |
[ 18.0% - 18.5% ] 18.16% | 936 | 5.6% |