British Married-Couple Family Poverty
COMPARE
British
Select to Compare
Married-Couple Family Poverty
British Married-Couple Family Poverty
4.3%
POVERTY | MARRIED-COUPLE FAMILIES
99.8/ 100
METRIC RATING
46th/ 347
METRIC RANK
British Married-Couple Family Poverty Correlation Chart
The statistical analysis conducted on geographies consisting of 521,525,466 people shows a substantial positive correlation between the proportion of British and poverty level among married-couple families in the United States with a correlation coefficient (R) of 0.567 and weighted average of 4.3%. On average, for every 1% (one percent) increase in British within a typical geography, there is an increase of 0.79% in poverty level among married-couple families.
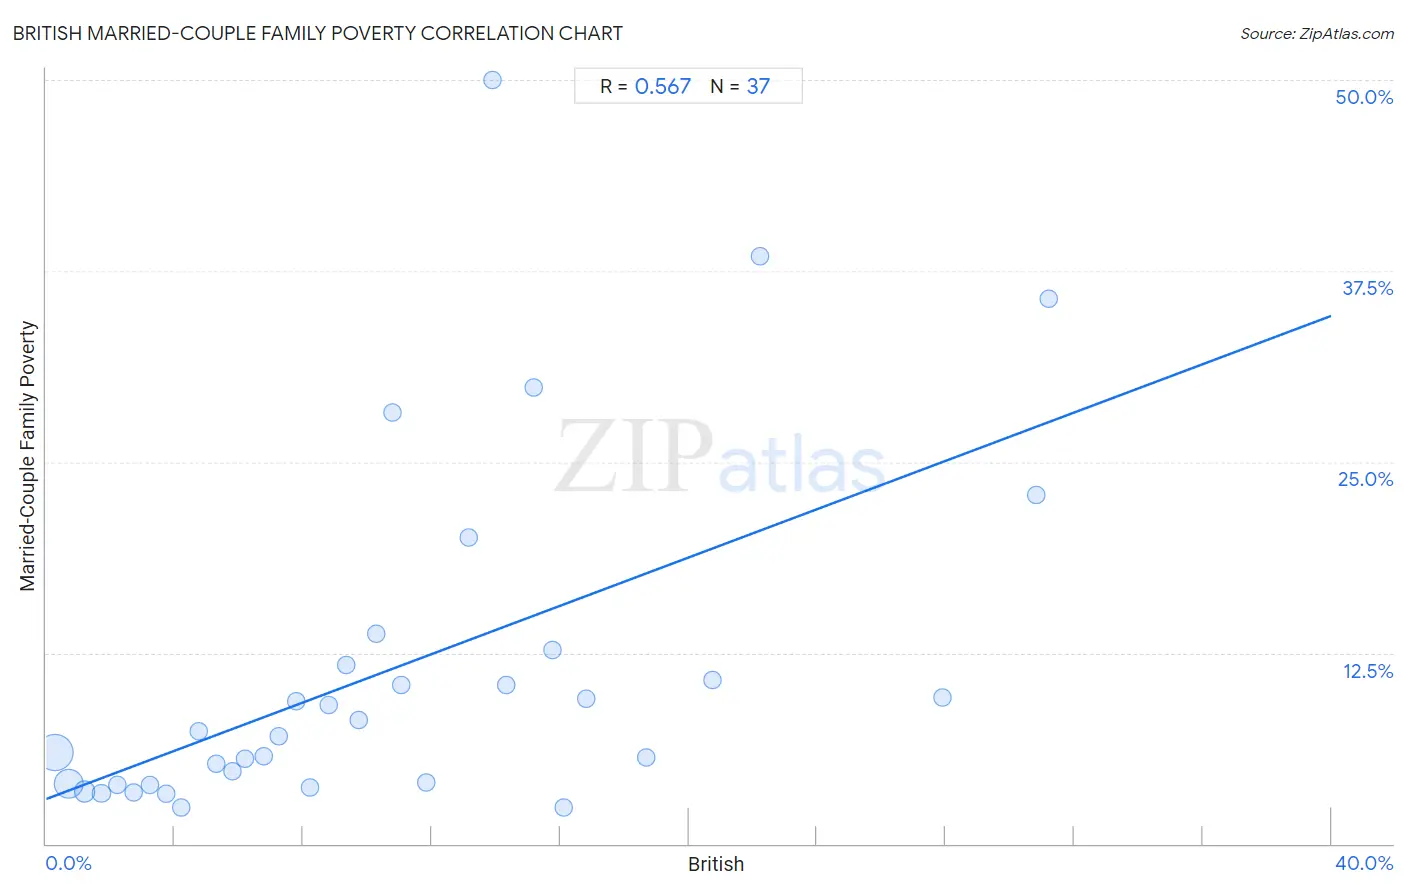
It is essential to understand that the correlation between the percentage of British and poverty level among married-couple families does not imply a direct cause-and-effect relationship. It remains uncertain whether the presence of British influences an upward or downward trend in the level of poverty level among married-couple families within an area, or if British simply ended up residing in those areas with higher or lower levels of poverty level among married-couple families due to other factors.
Demographics Similar to British by Married-Couple Family Poverty
In terms of married-couple family poverty, the demographic groups most similar to British are Serbian (4.3%, a difference of 0.030%), Immigrants from Japan (4.3%, a difference of 0.050%), Immigrants from South Central Asia (4.3%, a difference of 0.12%), Australian (4.3%, a difference of 0.19%), and Turkish (4.3%, a difference of 0.27%).
| Demographics | Rating | Rank | Married-Couple Family Poverty |
| Immigrants from Northern Europe | 99.8 /100 | #39 | Exceptional 4.2% |
| French Canadians | 99.8 /100 | #40 | Exceptional 4.2% |
| Northern Europeans | 99.8 /100 | #41 | Exceptional 4.3% |
| Scottish | 99.8 /100 | #42 | Exceptional 4.3% |
| Swiss | 99.8 /100 | #43 | Exceptional 4.3% |
| Immigrants from Japan | 99.8 /100 | #44 | Exceptional 4.3% |
| Serbians | 99.8 /100 | #45 | Exceptional 4.3% |
| British | 99.8 /100 | #46 | Exceptional 4.3% |
| Immigrants from South Central Asia | 99.8 /100 | #47 | Exceptional 4.3% |
| Australians | 99.7 /100 | #48 | Exceptional 4.3% |
| Turks | 99.7 /100 | #49 | Exceptional 4.3% |
| Burmese | 99.7 /100 | #50 | Exceptional 4.3% |
| Immigrants from Lithuania | 99.7 /100 | #51 | Exceptional 4.3% |
| Russians | 99.7 /100 | #52 | Exceptional 4.3% |
| Welsh | 99.7 /100 | #53 | Exceptional 4.3% |
British Married-Couple Family Poverty Correlation Summary
| Measurement | British Data | Married-Couple Family Poverty Data |
| Minimum | 0.26% | 2.4% |
| Maximum | 31.2% | 50.0% |
| Range | 30.9% | 47.6% |
| Mean | 10.8% | 11.5% |
| Median | 9.3% | 7.3% |
| Interquartile 25% (IQ1) | 4.5% | 3.9% |
| Interquartile 75% (IQ3) | 15.5% | 12.2% |
| Interquartile Range (IQR) | 11.0% | 8.3% |
| Standard Deviation (Sample) | 8.1% | 11.3% |
| Standard Deviation (Population) | 8.0% | 11.2% |
Correlation Details
| British Percentile | Sample Size | Married-Couple Family Poverty |
[ 0.0% - 0.5% ] 0.26% | 281,921,354 | 6.0% |
[ 0.5% - 1.0% ] 0.71% | 169,483,502 | 3.9% |
[ 1.0% - 1.5% ] 1.20% | 48,479,828 | 3.4% |
[ 1.5% - 2.0% ] 1.70% | 13,335,018 | 3.3% |
[ 2.0% - 2.5% ] 2.22% | 4,596,025 | 3.9% |
[ 2.5% - 3.0% ] 2.73% | 1,865,709 | 3.4% |
[ 3.0% - 3.5% ] 3.23% | 621,586 | 3.9% |
[ 3.5% - 4.0% ] 3.74% | 554,050 | 3.3% |
[ 4.0% - 4.5% ] 4.19% | 296,301 | 2.4% |
[ 4.5% - 5.0% ] 4.76% | 103,365 | 7.3% |
[ 5.0% - 5.5% ] 5.31% | 49,161 | 5.2% |
[ 5.5% - 6.0% ] 5.78% | 36,459 | 4.7% |
[ 6.0% - 6.5% ] 6.19% | 39,884 | 5.6% |
[ 6.5% - 7.0% ] 6.79% | 23,942 | 5.8% |
[ 7.0% - 7.5% ] 7.23% | 23,615 | 7.0% |
[ 7.5% - 8.0% ] 7.80% | 18,068 | 9.3% |
[ 8.0% - 8.5% ] 8.20% | 33,651 | 3.7% |
[ 8.5% - 9.0% ] 8.79% | 9,602 | 9.1% |
[ 9.0% - 9.5% ] 9.33% | 8,533 | 11.7% |
[ 9.5% - 10.0% ] 9.74% | 2,464 | 8.1% |
[ 10.0% - 10.5% ] 10.27% | 7,205 | 13.7% |
[ 10.5% - 11.0% ] 10.79% | 1,900 | 28.2% |
[ 11.0% - 11.5% ] 11.06% | 949 | 10.4% |
[ 11.5% - 12.0% ] 11.85% | 3,199 | 4.0% |
[ 13.0% - 13.5% ] 13.13% | 2,985 | 20.1% |
[ 13.5% - 14.0% ] 13.89% | 72 | 50.0% |
[ 14.0% - 14.5% ] 14.31% | 2,613 | 10.4% |
[ 15.0% - 15.5% ] 15.18% | 224 | 29.8% |
[ 15.5% - 16.0% ] 15.77% | 1,820 | 12.7% |
[ 16.0% - 16.5% ] 16.12% | 490 | 2.4% |
[ 16.5% - 17.0% ] 16.81% | 113 | 9.5% |
[ 18.5% - 19.0% ] 18.66% | 568 | 5.6% |
[ 20.5% - 21.0% ] 20.75% | 212 | 10.7% |
[ 22.0% - 22.5% ] 22.22% | 234 | 38.5% |
[ 27.5% - 28.0% ] 27.91% | 455 | 9.6% |
[ 30.5% - 31.0% ] 30.81% | 185 | 22.9% |
[ 31.0% - 31.5% ] 31.20% | 125 | 35.7% |