Bahamian Married-Couple Family Poverty
COMPARE
Bahamian
Select to Compare
Married-Couple Family Poverty
Bahamian Married-Couple Family Poverty
6.6%
POVERTY | MARRIED-COUPLE FAMILIES
0.0/ 100
METRIC RATING
294th/ 347
METRIC RANK
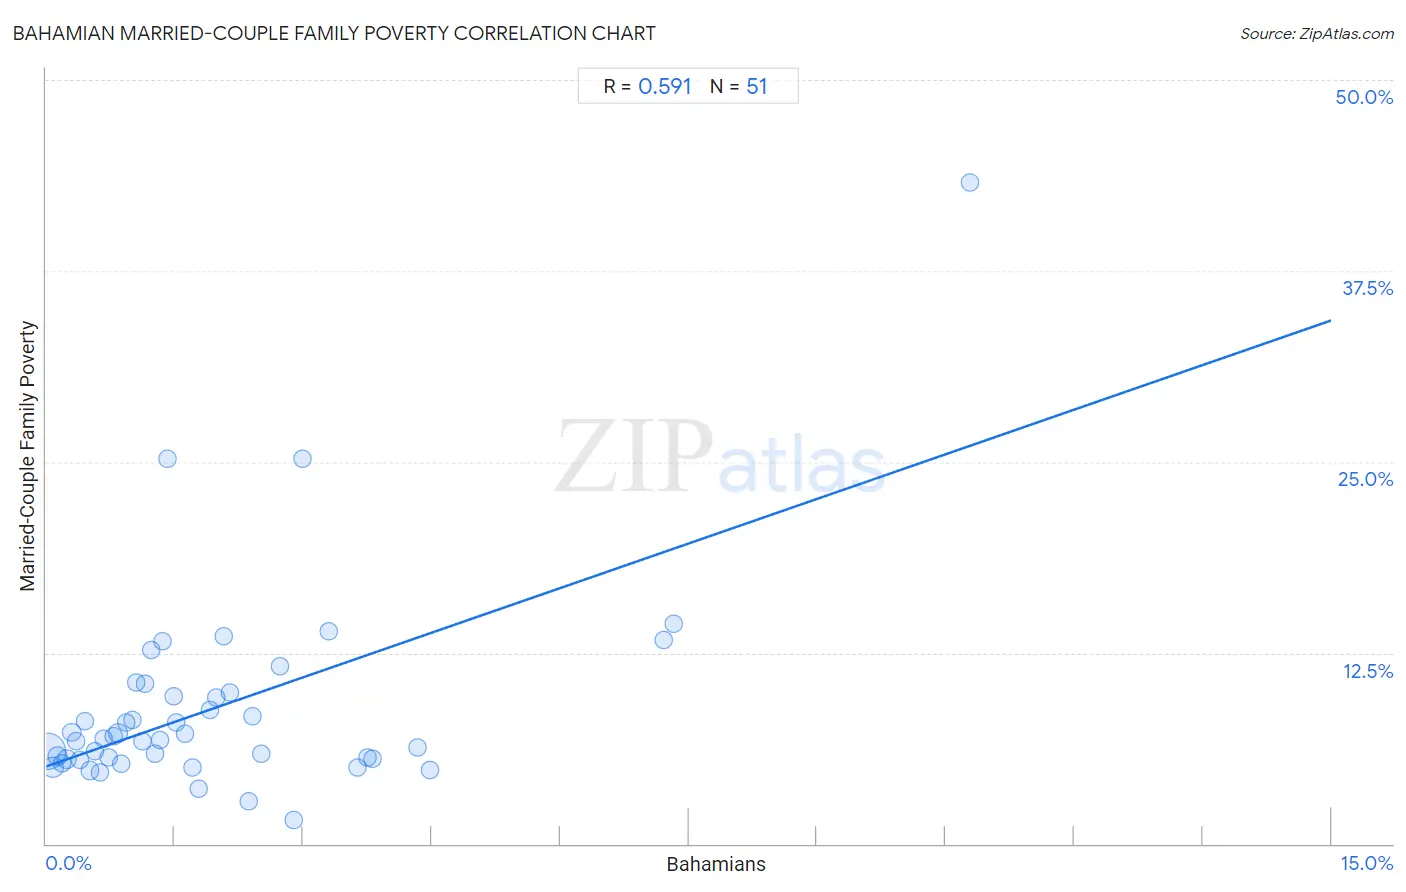
Bahamian Married-Couple Family Poverty Correlation Chart
The statistical analysis conducted on geographies consisting of 112,412,919 people shows a substantial positive correlation between the proportion of Bahamians and poverty level among married-couple families in the United States with a correlation coefficient (R) of 0.591 and weighted average of 6.6%. On average, for every 1% (one percent) increase in Bahamians within a typical geography, there is an increase of 1.9% in poverty level among married-couple families.
It is essential to understand that the correlation between the percentage of Bahamians and poverty level among married-couple families does not imply a direct cause-and-effect relationship. It remains uncertain whether the presence of Bahamians influences an upward or downward trend in the level of poverty level among married-couple families within an area, or if Bahamians simply ended up residing in those areas with higher or lower levels of poverty level among married-couple families due to other factors.
Demographics Similar to Bahamians by Married-Couple Family Poverty
In terms of married-couple family poverty, the demographic groups most similar to Bahamians are Immigrants from Uzbekistan (6.6%, a difference of 0.29%), U.S. Virgin Islander (6.6%, a difference of 0.39%), Kiowa (6.6%, a difference of 0.40%), Immigrants from Guyana (6.7%, a difference of 0.47%), and Arapaho (6.6%, a difference of 0.85%).
| Demographics | Rating | Rank | Married-Couple Family Poverty |
| Ecuadorians | 0.0 /100 | #287 | Tragic 6.5% |
| Salvadorans | 0.0 /100 | #288 | Tragic 6.5% |
| Nepalese | 0.0 /100 | #289 | Tragic 6.5% |
| Immigrants from Barbados | 0.0 /100 | #290 | Tragic 6.5% |
| Belizeans | 0.0 /100 | #291 | Tragic 6.5% |
| Immigrants from Lebanon | 0.0 /100 | #292 | Tragic 6.6% |
| Arapaho | 0.0 /100 | #293 | Tragic 6.6% |
| Bahamians | 0.0 /100 | #294 | Tragic 6.6% |
| Immigrants from Uzbekistan | 0.0 /100 | #295 | Tragic 6.6% |
| U.S. Virgin Islanders | 0.0 /100 | #296 | Tragic 6.6% |
| Kiowa | 0.0 /100 | #297 | Tragic 6.6% |
| Immigrants from Guyana | 0.0 /100 | #298 | Tragic 6.7% |
| Nicaraguans | 0.0 /100 | #299 | Tragic 6.7% |
| Immigrants from Belize | 0.0 /100 | #300 | Tragic 6.7% |
| Central Americans | 0.0 /100 | #301 | Tragic 6.7% |
Bahamian Married-Couple Family Poverty Correlation Summary
| Measurement | Bahamian Data | Married-Couple Family Poverty Data |
| Minimum | 0.017% | 1.6% |
| Maximum | 10.8% | 43.3% |
| Range | 10.8% | 41.8% |
| Mean | 2.0% | 8.9% |
| Median | 1.4% | 6.8% |
| Interquartile 25% (IQ1) | 0.67% | 5.5% |
| Interquartile 75% (IQ3) | 2.5% | 9.9% |
| Interquartile Range (IQR) | 1.8% | 4.4% |
| Standard Deviation (Sample) | 2.0% | 6.7% |
| Standard Deviation (Population) | 2.0% | 6.6% |
Correlation Details
| Bahamian Percentile | Sample Size | Married-Couple Family Poverty |
[ 0.0% - 0.5% ] 0.017% | 79,504,713 | 6.1% |
[ 0.0% - 0.5% ] 0.077% | 12,639,571 | 5.0% |
[ 0.0% - 0.5% ] 0.13% | 6,200,765 | 5.7% |
[ 0.0% - 0.5% ] 0.19% | 3,550,983 | 5.3% |
[ 0.0% - 0.5% ] 0.24% | 1,421,013 | 5.5% |
[ 0.0% - 0.5% ] 0.29% | 1,844,834 | 7.3% |
[ 0.0% - 0.5% ] 0.35% | 889,430 | 6.7% |
[ 0.0% - 0.5% ] 0.40% | 742,021 | 5.5% |
[ 0.0% - 0.5% ] 0.46% | 688,153 | 8.0% |
[ 0.5% - 1.0% ] 0.51% | 745,425 | 4.8% |
[ 0.5% - 1.0% ] 0.57% | 565,412 | 6.1% |
[ 0.5% - 1.0% ] 0.62% | 509,767 | 4.7% |
[ 0.5% - 1.0% ] 0.67% | 563,351 | 6.8% |
[ 0.5% - 1.0% ] 0.73% | 283,431 | 5.7% |
[ 0.5% - 1.0% ] 0.79% | 216,539 | 7.0% |
[ 0.5% - 1.0% ] 0.84% | 264,243 | 7.2% |
[ 0.5% - 1.0% ] 0.88% | 124,563 | 5.2% |
[ 0.5% - 1.0% ] 0.94% | 189,649 | 7.9% |
[ 1.0% - 1.5% ] 1.00% | 283,749 | 8.1% |
[ 1.0% - 1.5% ] 1.05% | 69,608 | 10.6% |
[ 1.0% - 1.5% ] 1.12% | 46,612 | 6.7% |
[ 1.0% - 1.5% ] 1.15% | 60,436 | 10.4% |
[ 1.0% - 1.5% ] 1.23% | 31,590 | 12.7% |
[ 1.0% - 1.5% ] 1.27% | 109,405 | 5.9% |
[ 1.0% - 1.5% ] 1.33% | 74,297 | 6.8% |
[ 1.0% - 1.5% ] 1.36% | 24,607 | 13.3% |
[ 1.0% - 1.5% ] 1.42% | 18,091 | 25.2% |
[ 1.0% - 1.5% ] 1.48% | 145,059 | 9.6% |
[ 1.5% - 2.0% ] 1.52% | 176,766 | 7.9% |
[ 1.5% - 2.0% ] 1.62% | 46,108 | 7.2% |
[ 1.5% - 2.0% ] 1.70% | 86,097 | 5.0% |
[ 1.5% - 2.0% ] 1.78% | 338 | 3.6% |
[ 1.5% - 2.0% ] 1.91% | 47,981 | 8.7% |
[ 1.5% - 2.0% ] 1.98% | 14,126 | 9.5% |
[ 2.0% - 2.5% ] 2.07% | 8,340 | 13.6% |
[ 2.0% - 2.5% ] 2.15% | 37,274 | 9.9% |
[ 2.0% - 2.5% ] 2.37% | 7,689 | 2.8% |
[ 2.0% - 2.5% ] 2.40% | 16,449 | 8.3% |
[ 2.5% - 3.0% ] 2.51% | 3,192 | 5.9% |
[ 2.5% - 3.0% ] 2.73% | 48,792 | 11.6% |
[ 2.5% - 3.0% ] 2.88% | 27,583 | 1.6% |
[ 2.5% - 3.0% ] 2.98% | 6,266 | 25.2% |
[ 3.0% - 3.5% ] 3.30% | 7,385 | 13.9% |
[ 3.5% - 4.0% ] 3.64% | 9,677 | 5.0% |
[ 3.5% - 4.0% ] 3.74% | 1,950 | 5.6% |
[ 3.5% - 4.0% ] 3.81% | 18,487 | 5.6% |
[ 4.0% - 4.5% ] 4.34% | 8,118 | 6.3% |
[ 4.0% - 4.5% ] 4.48% | 15,735 | 4.8% |
[ 7.0% - 7.5% ] 7.21% | 14,698 | 13.3% |
[ 7.0% - 7.5% ] 7.32% | 1,011 | 14.4% |
[ 10.5% - 11.0% ] 10.78% | 1,540 | 43.3% |