Guatemalan Married-Couple Family Poverty
COMPARE
Guatemalan
Select to Compare
Married-Couple Family Poverty
Guatemalan Married-Couple Family Poverty
7.0%
POVERTY | MARRIED-COUPLE FAMILIES
0.0/ 100
METRIC RATING
307th/ 347
METRIC RANK
Guatemalan Married-Couple Family Poverty Correlation Chart
The statistical analysis conducted on geographies consisting of 406,520,979 people shows a moderate positive correlation between the proportion of Guatemalans and poverty level among married-couple families in the United States with a correlation coefficient (R) of 0.415 and weighted average of 7.0%. On average, for every 1% (one percent) increase in Guatemalans within a typical geography, there is an increase of 0.26% in poverty level among married-couple families.
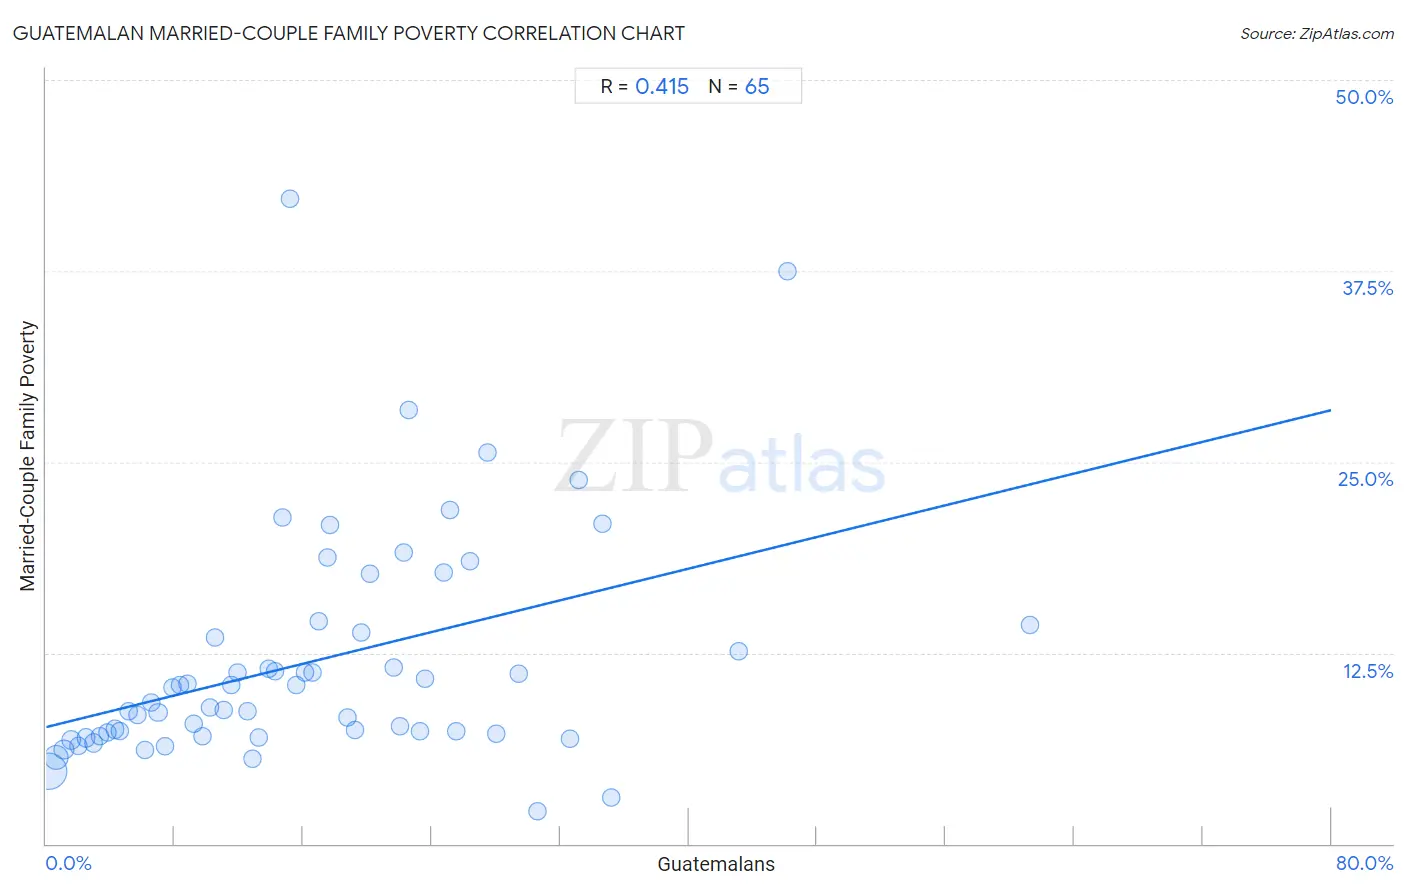
It is essential to understand that the correlation between the percentage of Guatemalans and poverty level among married-couple families does not imply a direct cause-and-effect relationship. It remains uncertain whether the presence of Guatemalans influences an upward or downward trend in the level of poverty level among married-couple families within an area, or if Guatemalans simply ended up residing in those areas with higher or lower levels of poverty level among married-couple families due to other factors.
Demographics Similar to Guatemalans by Married-Couple Family Poverty
In terms of married-couple family poverty, the demographic groups most similar to Guatemalans are Spanish American Indian (7.1%, a difference of 0.18%), Hopi (7.1%, a difference of 0.78%), Immigrants from Nicaragua (7.1%, a difference of 0.81%), Immigrants from Dominica (7.1%, a difference of 0.86%), and Immigrants from Armenia (7.1%, a difference of 0.86%).
| Demographics | Rating | Rank | Married-Couple Family Poverty |
| Immigrants from Belize | 0.0 /100 | #300 | Tragic 6.7% |
| Central Americans | 0.0 /100 | #301 | Tragic 6.7% |
| Immigrants from Ecuador | 0.0 /100 | #302 | Tragic 6.7% |
| Immigrants from El Salvador | 0.0 /100 | #303 | Tragic 6.8% |
| Cubans | 0.0 /100 | #304 | Tragic 6.8% |
| Haitians | 0.0 /100 | #305 | Tragic 6.8% |
| Immigrants from Haiti | 0.0 /100 | #306 | Tragic 7.0% |
| Guatemalans | 0.0 /100 | #307 | Tragic 7.0% |
| Spanish American Indians | 0.0 /100 | #308 | Tragic 7.1% |
| Hopi | 0.0 /100 | #309 | Tragic 7.1% |
| Immigrants from Nicaragua | 0.0 /100 | #310 | Tragic 7.1% |
| Immigrants from Dominica | 0.0 /100 | #311 | Tragic 7.1% |
| Immigrants from Armenia | 0.0 /100 | #312 | Tragic 7.1% |
| Immigrants from St. Vincent and the Grenadines | 0.0 /100 | #313 | Tragic 7.1% |
| British West Indians | 0.0 /100 | #314 | Tragic 7.1% |
Guatemalan Married-Couple Family Poverty Correlation Summary
| Measurement | Guatemalan Data | Married-Couple Family Poverty Data |
| Minimum | 0.18% | 2.1% |
| Maximum | 61.2% | 42.2% |
| Range | 61.1% | 40.1% |
| Mean | 16.6% | 11.9% |
| Median | 14.7% | 9.3% |
| Interquartile 25% (IQ1) | 7.2% | 7.1% |
| Interquartile 75% (IQ3) | 23.4% | 14.1% |
| Interquartile Range (IQR) | 16.3% | 7.0% |
| Standard Deviation (Sample) | 12.1% | 7.5% |
| Standard Deviation (Population) | 12.0% | 7.5% |
Correlation Details
| Guatemalan Percentile | Sample Size | Married-Couple Family Poverty |
[ 0.0% - 0.5% ] 0.18% | 242,086,518 | 4.7% |
[ 0.5% - 1.0% ] 0.63% | 82,024,887 | 5.7% |
[ 1.0% - 1.5% ] 1.12% | 27,603,944 | 6.2% |
[ 1.5% - 2.0% ] 1.57% | 17,140,293 | 6.8% |
[ 2.0% - 2.5% ] 2.01% | 9,120,572 | 6.4% |
[ 2.0% - 2.5% ] 2.46% | 5,793,445 | 6.9% |
[ 2.5% - 3.0% ] 2.95% | 4,576,102 | 6.6% |
[ 3.0% - 3.5% ] 3.36% | 2,137,669 | 7.0% |
[ 3.5% - 4.0% ] 3.81% | 1,737,037 | 7.3% |
[ 4.0% - 4.5% ] 4.26% | 1,681,881 | 7.5% |
[ 4.5% - 5.0% ] 4.61% | 4,899,900 | 7.4% |
[ 5.0% - 5.5% ] 5.17% | 1,056,572 | 8.7% |
[ 5.5% - 6.0% ] 5.67% | 594,752 | 8.4% |
[ 6.0% - 6.5% ] 6.12% | 585,463 | 6.1% |
[ 6.5% - 7.0% ] 6.52% | 482,779 | 9.3% |
[ 6.5% - 7.0% ] 6.96% | 435,539 | 8.6% |
[ 7.0% - 7.5% ] 7.38% | 630,094 | 6.4% |
[ 7.5% - 8.0% ] 7.85% | 383,703 | 10.3% |
[ 8.0% - 8.5% ] 8.30% | 438,643 | 10.4% |
[ 8.5% - 9.0% ] 8.82% | 291,953 | 10.5% |
[ 9.0% - 9.5% ] 9.22% | 303,303 | 7.9% |
[ 9.5% - 10.0% ] 9.72% | 266,046 | 7.0% |
[ 10.0% - 10.5% ] 10.22% | 332,512 | 9.0% |
[ 10.5% - 11.0% ] 10.54% | 249,510 | 13.5% |
[ 11.0% - 11.5% ] 11.07% | 354,124 | 8.8% |
[ 11.5% - 12.0% ] 11.50% | 137,472 | 10.4% |
[ 11.5% - 12.0% ] 11.94% | 89,720 | 11.2% |
[ 12.5% - 13.0% ] 12.51% | 125,980 | 8.6% |
[ 12.5% - 13.0% ] 12.81% | 22,506 | 5.5% |
[ 13.0% - 13.5% ] 13.23% | 133,872 | 7.0% |
[ 13.5% - 14.0% ] 13.86% | 96,932 | 11.5% |
[ 14.0% - 14.5% ] 14.27% | 46,669 | 11.3% |
[ 14.5% - 15.0% ] 14.69% | 28,754 | 21.3% |
[ 15.0% - 15.5% ] 15.15% | 4,733 | 42.2% |
[ 15.5% - 16.0% ] 15.56% | 81,504 | 10.4% |
[ 16.0% - 16.5% ] 16.13% | 78,939 | 11.3% |
[ 16.5% - 17.0% ] 16.59% | 38,648 | 11.2% |
[ 16.5% - 17.0% ] 16.94% | 12,802 | 14.5% |
[ 17.0% - 17.5% ] 17.48% | 2,368 | 18.8% |
[ 17.5% - 18.0% ] 17.66% | 9,689 | 20.9% |
[ 18.5% - 19.0% ] 18.73% | 7,495 | 8.3% |
[ 19.0% - 19.5% ] 19.18% | 12,641 | 7.5% |
[ 19.5% - 20.0% ] 19.62% | 102,397 | 13.9% |
[ 20.0% - 20.5% ] 20.16% | 4,181 | 17.7% |
[ 21.5% - 22.0% ] 21.63% | 39,358 | 11.6% |
[ 22.0% - 22.5% ] 22.04% | 20,072 | 7.7% |
[ 22.0% - 22.5% ] 22.25% | 6,624 | 19.1% |
[ 22.5% - 23.0% ] 22.60% | 36,405 | 28.4% |
[ 23.0% - 23.5% ] 23.29% | 292 | 7.3% |
[ 23.5% - 24.0% ] 23.56% | 50,387 | 10.8% |
[ 24.5% - 25.0% ] 24.75% | 6,589 | 17.7% |
[ 25.0% - 25.5% ] 25.11% | 57,033 | 21.9% |
[ 25.5% - 26.0% ] 25.55% | 407 | 7.3% |
[ 26.0% - 26.5% ] 26.37% | 5,468 | 18.5% |
[ 27.0% - 27.5% ] 27.49% | 211 | 25.6% |
[ 27.5% - 28.0% ] 27.98% | 2,205 | 7.2% |
[ 29.0% - 29.5% ] 29.43% | 10,418 | 11.1% |
[ 30.5% - 31.0% ] 30.55% | 635 | 2.1% |
[ 32.5% - 33.0% ] 32.60% | 2,506 | 6.9% |
[ 33.0% - 33.5% ] 33.18% | 4,385 | 23.8% |
[ 34.5% - 35.0% ] 34.63% | 10,371 | 21.0% |
[ 35.0% - 35.5% ] 35.17% | 981 | 3.0% |
[ 43.0% - 43.5% ] 43.14% | 21,778 | 12.6% |
[ 46.0% - 46.5% ] 46.15% | 182 | 37.5% |
[ 61.0% - 61.5% ] 61.24% | 129 | 14.3% |