Thai Married-Couple Family Poverty
COMPARE
Thai
Select to Compare
Married-Couple Family Poverty
Thai Married-Couple Family Poverty
3.9%
POVERTY | MARRIED-COUPLE FAMILIES
100.0/ 100
METRIC RATING
8th/ 347
METRIC RANK
Thai Married-Couple Family Poverty Correlation Chart
The statistical analysis conducted on geographies consisting of 469,612,983 people shows a mild negative correlation between the proportion of Thais and poverty level among married-couple families in the United States with a correlation coefficient (R) of -0.358 and weighted average of 3.9%. On average, for every 1% (one percent) increase in Thais within a typical geography, there is a decrease of 0.040% in poverty level among married-couple families.
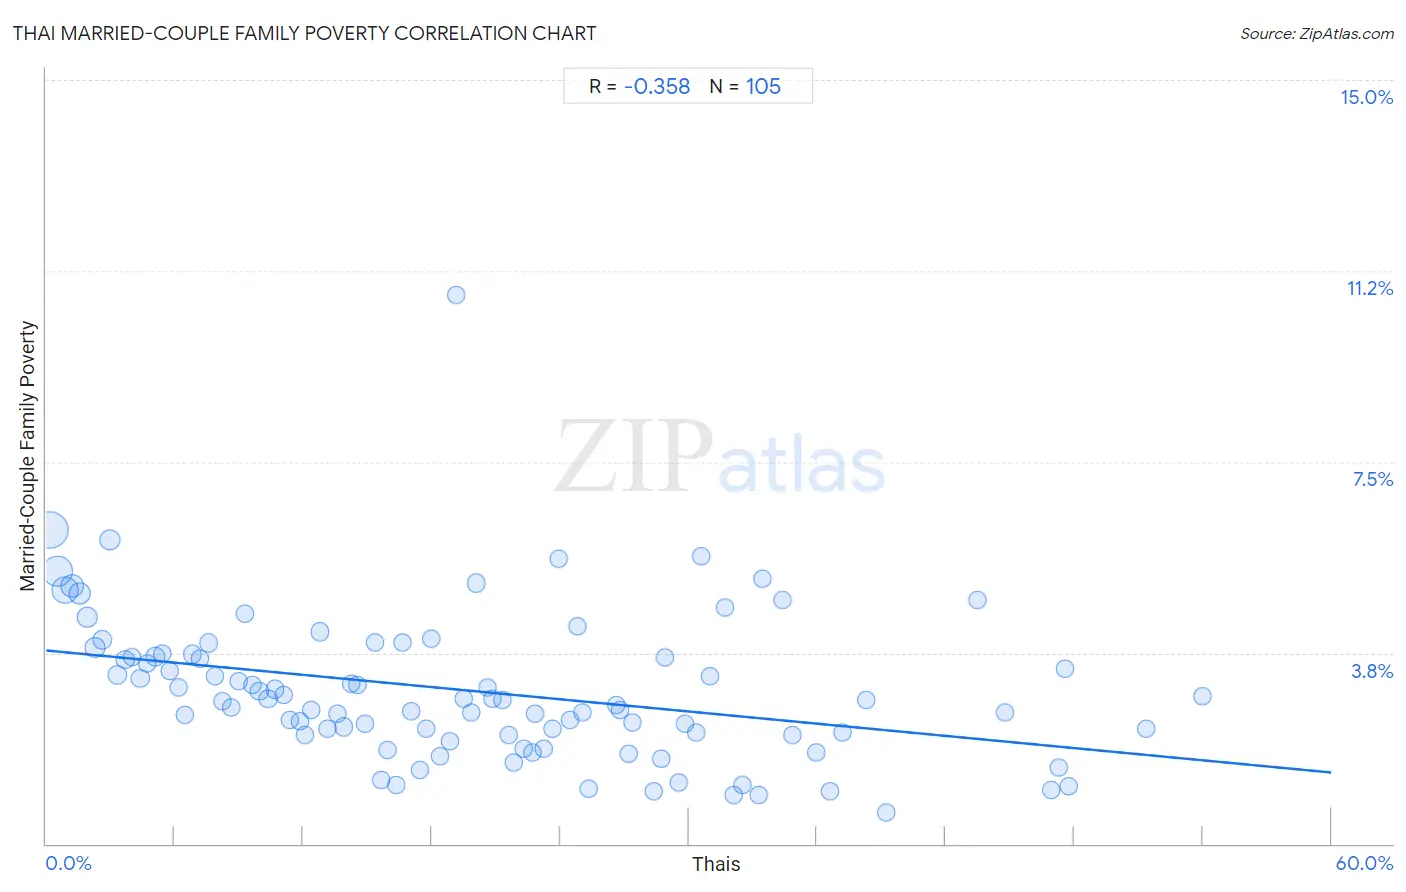
It is essential to understand that the correlation between the percentage of Thais and poverty level among married-couple families does not imply a direct cause-and-effect relationship. It remains uncertain whether the presence of Thais influences an upward or downward trend in the level of poverty level among married-couple families within an area, or if Thais simply ended up residing in those areas with higher or lower levels of poverty level among married-couple families due to other factors.
Demographics Similar to Thais by Married-Couple Family Poverty
In terms of married-couple family poverty, the demographic groups most similar to Thais are Croatian (3.9%, a difference of 0.44%), Carpatho Rusyn (3.9%, a difference of 0.49%), Latvian (3.9%, a difference of 0.54%), Lithuanian (4.0%, a difference of 1.0%), and Luxembourger (3.9%, a difference of 1.1%).
| Demographics | Rating | Rank | Married-Couple Family Poverty |
| Immigrants from India | 100.0 /100 | #1 | Exceptional 3.6% |
| Chinese | 100.0 /100 | #2 | Exceptional 3.6% |
| Norwegians | 100.0 /100 | #3 | Exceptional 3.7% |
| Slovenes | 100.0 /100 | #4 | Exceptional 3.8% |
| Swedes | 100.0 /100 | #5 | Exceptional 3.9% |
| Luxembourgers | 100.0 /100 | #6 | Exceptional 3.9% |
| Latvians | 100.0 /100 | #7 | Exceptional 3.9% |
| Thais | 100.0 /100 | #8 | Exceptional 3.9% |
| Croatians | 100.0 /100 | #9 | Exceptional 3.9% |
| Carpatho Rusyns | 100.0 /100 | #10 | Exceptional 3.9% |
| Lithuanians | 100.0 /100 | #11 | Exceptional 4.0% |
| Bulgarians | 100.0 /100 | #12 | Exceptional 4.0% |
| Czechs | 100.0 /100 | #13 | Exceptional 4.0% |
| Slovaks | 100.0 /100 | #14 | Exceptional 4.0% |
| Poles | 100.0 /100 | #15 | Exceptional 4.0% |
Thai Married-Couple Family Poverty Correlation Summary
| Measurement | Thai Data | Married-Couple Family Poverty Data |
| Minimum | 0.16% | 0.61% |
| Maximum | 54.0% | 10.8% |
| Range | 53.8% | 10.2% |
| Mean | 19.8% | 3.0% |
| Median | 18.4% | 2.8% |
| Interquartile 25% (IQ1) | 9.1% | 2.1% |
| Interquartile 75% (IQ3) | 28.8% | 3.7% |
| Interquartile Range (IQR) | 19.6% | 1.6% |
| Standard Deviation (Sample) | 13.1% | 1.5% |
| Standard Deviation (Population) | 13.0% | 1.5% |
Correlation Details
| Thai Percentile | Sample Size | Married-Couple Family Poverty |
[ 0.0% - 0.5% ] 0.16% | 127,161,697 | 6.2% |
[ 0.5% - 1.0% ] 0.52% | 85,277,080 | 5.3% |
[ 0.5% - 1.0% ] 0.86% | 58,507,477 | 5.0% |
[ 1.0% - 1.5% ] 1.20% | 37,822,632 | 5.1% |
[ 1.5% - 2.0% ] 1.56% | 29,785,475 | 4.9% |
[ 1.5% - 2.0% ] 1.90% | 20,618,358 | 4.5% |
[ 2.0% - 2.5% ] 2.27% | 16,368,704 | 3.8% |
[ 2.5% - 3.0% ] 2.61% | 11,285,042 | 4.0% |
[ 2.5% - 3.0% ] 2.96% | 18,699,394 | 6.0% |
[ 3.0% - 3.5% ] 3.32% | 10,273,686 | 3.3% |
[ 3.5% - 4.0% ] 3.67% | 5,234,964 | 3.6% |
[ 4.0% - 4.5% ] 4.01% | 5,193,265 | 3.7% |
[ 4.0% - 4.5% ] 4.38% | 4,873,332 | 3.3% |
[ 4.5% - 5.0% ] 4.73% | 3,841,374 | 3.5% |
[ 5.0% - 5.5% ] 5.09% | 3,316,241 | 3.7% |
[ 5.0% - 5.5% ] 5.42% | 2,213,359 | 3.7% |
[ 5.5% - 6.0% ] 5.76% | 3,199,666 | 3.4% |
[ 6.0% - 6.5% ] 6.16% | 1,801,425 | 3.1% |
[ 6.0% - 6.5% ] 6.50% | 1,488,961 | 2.5% |
[ 6.5% - 7.0% ] 6.81% | 1,405,094 | 3.7% |
[ 7.0% - 7.5% ] 7.20% | 1,069,756 | 3.6% |
[ 7.5% - 8.0% ] 7.60% | 1,942,552 | 3.9% |
[ 7.5% - 8.0% ] 7.89% | 1,112,333 | 3.3% |
[ 8.0% - 8.5% ] 8.24% | 754,146 | 2.8% |
[ 8.5% - 9.0% ] 8.62% | 786,540 | 2.7% |
[ 8.5% - 9.0% ] 8.98% | 579,377 | 3.2% |
[ 9.0% - 9.5% ] 9.29% | 689,842 | 4.5% |
[ 9.5% - 10.0% ] 9.63% | 690,402 | 3.1% |
[ 9.5% - 10.0% ] 9.95% | 607,133 | 3.0% |
[ 10.0% - 10.5% ] 10.36% | 525,772 | 2.9% |
[ 10.5% - 11.0% ] 10.67% | 537,598 | 3.0% |
[ 11.0% - 11.5% ] 11.07% | 620,929 | 2.9% |
[ 11.0% - 11.5% ] 11.38% | 919,344 | 2.4% |
[ 11.5% - 12.0% ] 11.82% | 164,667 | 2.4% |
[ 12.0% - 12.5% ] 12.07% | 515,518 | 2.1% |
[ 12.0% - 12.5% ] 12.37% | 418,481 | 2.6% |
[ 12.5% - 13.0% ] 12.80% | 842,011 | 4.2% |
[ 13.0% - 13.5% ] 13.10% | 419,554 | 2.3% |
[ 13.5% - 14.0% ] 13.63% | 479,374 | 2.6% |
[ 13.5% - 14.0% ] 13.88% | 285,754 | 2.3% |
[ 14.0% - 14.5% ] 14.23% | 373,206 | 3.1% |
[ 14.5% - 15.0% ] 14.56% | 674,122 | 3.1% |
[ 14.5% - 15.0% ] 14.89% | 211,887 | 2.3% |
[ 15.0% - 15.5% ] 15.35% | 391,669 | 3.9% |
[ 15.5% - 16.0% ] 15.63% | 199,259 | 1.3% |
[ 15.5% - 16.0% ] 15.96% | 143,844 | 1.8% |
[ 16.0% - 16.5% ] 16.34% | 88,523 | 1.2% |
[ 16.5% - 17.0% ] 16.61% | 206,657 | 4.0% |
[ 17.0% - 17.5% ] 17.02% | 75,830 | 2.6% |
[ 17.0% - 17.5% ] 17.47% | 34,484 | 1.5% |
[ 17.5% - 18.0% ] 17.72% | 482,187 | 2.3% |
[ 18.0% - 18.5% ] 18.00% | 258,449 | 4.0% |
[ 18.0% - 18.5% ] 18.36% | 95,553 | 1.7% |
[ 18.5% - 19.0% ] 18.83% | 149,718 | 2.0% |
[ 19.0% - 19.5% ] 19.14% | 8,883 | 10.8% |
[ 19.5% - 20.0% ] 19.51% | 332,773 | 2.9% |
[ 19.5% - 20.0% ] 19.85% | 121,376 | 2.6% |
[ 20.0% - 20.5% ] 20.10% | 213,644 | 5.1% |
[ 20.5% - 21.0% ] 20.62% | 84,480 | 3.1% |
[ 20.5% - 21.0% ] 20.81% | 268,320 | 2.8% |
[ 21.0% - 21.5% ] 21.28% | 139,153 | 2.8% |
[ 21.5% - 22.0% ] 21.57% | 93,540 | 2.1% |
[ 21.5% - 22.0% ] 21.83% | 103,197 | 1.6% |
[ 22.0% - 22.5% ] 22.29% | 120,806 | 1.9% |
[ 22.5% - 23.0% ] 22.68% | 208,151 | 1.8% |
[ 22.5% - 23.0% ] 22.84% | 106,155 | 2.5% |
[ 23.0% - 23.5% ] 23.25% | 36,973 | 1.9% |
[ 23.5% - 24.0% ] 23.64% | 101,208 | 2.3% |
[ 23.5% - 24.0% ] 23.95% | 48,552 | 5.6% |
[ 24.0% - 24.5% ] 24.45% | 248,641 | 2.4% |
[ 24.5% - 25.0% ] 24.81% | 8,456 | 4.3% |
[ 25.0% - 25.5% ] 25.01% | 20,339 | 2.6% |
[ 25.0% - 25.5% ] 25.33% | 27,770 | 1.1% |
[ 26.5% - 27.0% ] 26.61% | 27,571 | 2.7% |
[ 26.5% - 27.0% ] 26.78% | 114,355 | 2.6% |
[ 27.0% - 27.5% ] 27.23% | 188,552 | 1.8% |
[ 27.0% - 27.5% ] 27.38% | 22,077 | 2.4% |
[ 28.0% - 28.5% ] 28.34% | 18,949 | 1.0% |
[ 28.5% - 29.0% ] 28.70% | 69,659 | 1.7% |
[ 28.5% - 29.0% ] 28.87% | 95,382 | 3.7% |
[ 29.5% - 30.0% ] 29.54% | 62,554 | 1.2% |
[ 29.5% - 30.0% ] 29.83% | 254,494 | 2.4% |
[ 30.0% - 30.5% ] 30.38% | 71,366 | 2.2% |
[ 30.5% - 31.0% ] 30.61% | 51,153 | 5.6% |
[ 30.5% - 31.0% ] 30.98% | 87,385 | 3.3% |
[ 31.5% - 32.0% ] 31.68% | 30,392 | 4.6% |
[ 32.0% - 32.5% ] 32.12% | 3,695 | 0.97% |
[ 32.5% - 33.0% ] 32.52% | 61,363 | 1.1% |
[ 33.0% - 33.5% ] 33.28% | 5,018 | 0.97% |
[ 33.0% - 33.5% ] 33.44% | 21,806 | 5.2% |
[ 34.0% - 34.5% ] 34.38% | 15,702 | 4.8% |
[ 34.5% - 35.0% ] 34.86% | 68,587 | 2.1% |
[ 35.5% - 36.0% ] 35.98% | 29,756 | 1.8% |
[ 36.5% - 37.0% ] 36.59% | 20,954 | 1.0% |
[ 37.0% - 37.5% ] 37.20% | 53,464 | 2.2% |
[ 38.0% - 38.5% ] 38.27% | 23,274 | 2.8% |
[ 39.0% - 39.5% ] 39.23% | 6,773 | 0.61% |
[ 43.0% - 43.5% ] 43.50% | 9,750 | 4.8% |
[ 44.5% - 45.0% ] 44.79% | 53,744 | 2.6% |
[ 46.5% - 47.0% ] 46.92% | 21,452 | 1.0% |
[ 47.0% - 47.5% ] 47.30% | 20,693 | 1.5% |
[ 47.5% - 48.0% ] 47.55% | 44,570 | 3.4% |
[ 47.5% - 48.0% ] 47.76% | 10,514 | 1.1% |
[ 51.0% - 51.5% ] 51.35% | 2,300 | 2.2% |
[ 53.5% - 54.0% ] 53.98% | 39,565 | 2.9% |