Creek Married-Couple Family Poverty
COMPARE
Creek
Select to Compare
Married-Couple Family Poverty
Creek Married-Couple Family Poverty
6.2%
POVERTY | MARRIED-COUPLE FAMILIES
0.2/ 100
METRIC RATING
266th/ 347
METRIC RANK
Creek Married-Couple Family Poverty Correlation Chart
The statistical analysis conducted on geographies consisting of 177,846,952 people shows a mild positive correlation between the proportion of Creek and poverty level among married-couple families in the United States with a correlation coefficient (R) of 0.312 and weighted average of 6.2%. On average, for every 1% (one percent) increase in Creek within a typical geography, there is an increase of 0.22% in poverty level among married-couple families.
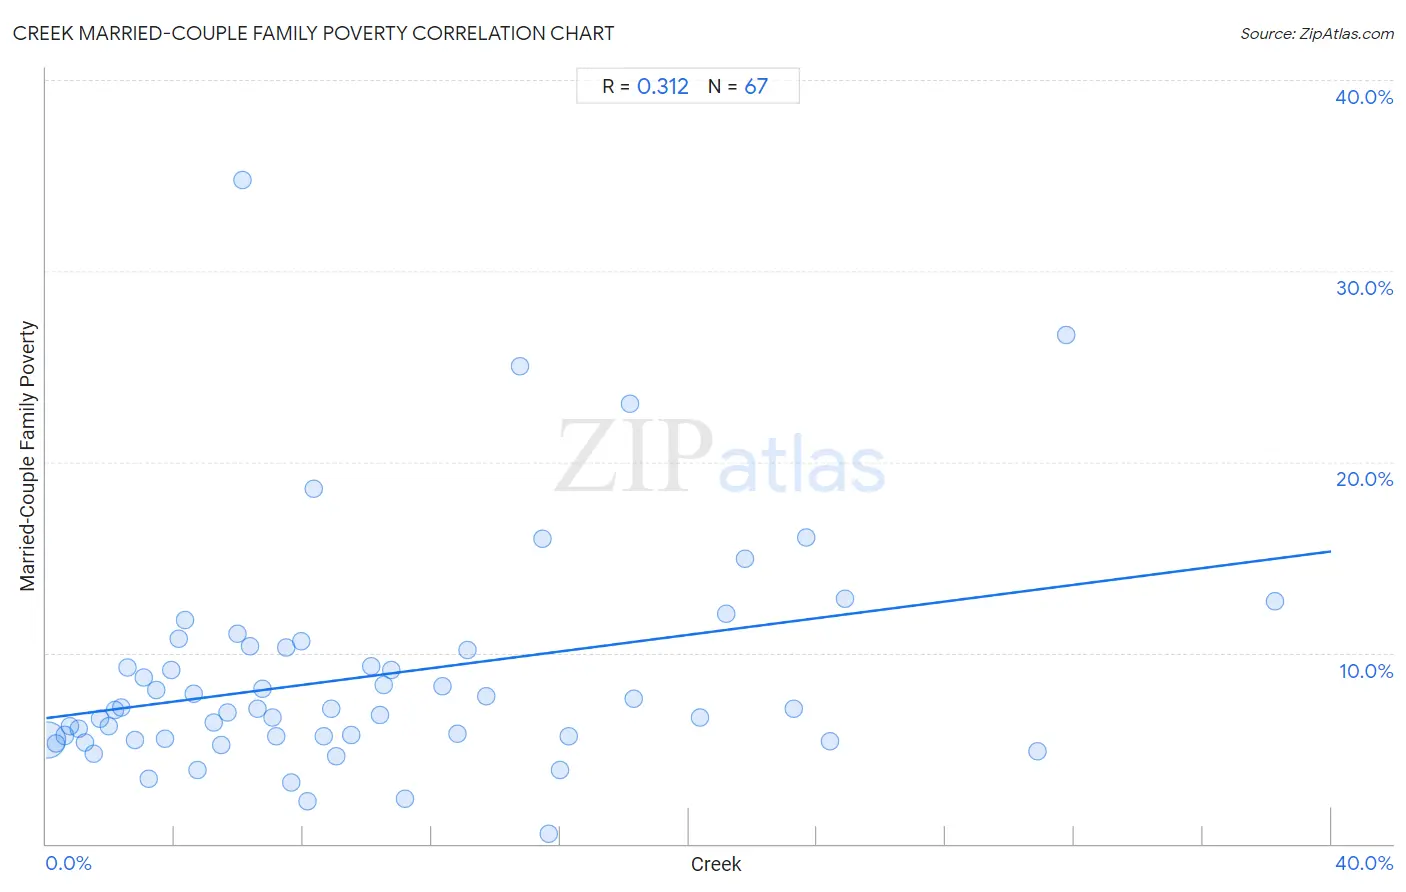
It is essential to understand that the correlation between the percentage of Creek and poverty level among married-couple families does not imply a direct cause-and-effect relationship. It remains uncertain whether the presence of Creek influences an upward or downward trend in the level of poverty level among married-couple families within an area, or if Creek simply ended up residing in those areas with higher or lower levels of poverty level among married-couple families due to other factors.
Demographics Similar to Creek by Married-Couple Family Poverty
In terms of married-couple family poverty, the demographic groups most similar to Creek are Spanish American (6.2%, a difference of 0.050%), Blackfeet (6.2%, a difference of 0.080%), Immigrants from Congo (6.1%, a difference of 0.51%), Alaska Native (6.2%, a difference of 0.53%), and Immigrants from West Indies (6.2%, a difference of 0.70%).
| Demographics | Rating | Rank | Married-Couple Family Poverty |
| Alaskan Athabascans | 0.4 /100 | #259 | Tragic 6.1% |
| Jamaicans | 0.3 /100 | #260 | Tragic 6.1% |
| Senegalese | 0.3 /100 | #261 | Tragic 6.1% |
| Shoshone | 0.3 /100 | #262 | Tragic 6.1% |
| Immigrants from Senegal | 0.3 /100 | #263 | Tragic 6.1% |
| Immigrants from Congo | 0.2 /100 | #264 | Tragic 6.1% |
| Blackfeet | 0.2 /100 | #265 | Tragic 6.2% |
| Creek | 0.2 /100 | #266 | Tragic 6.2% |
| Spanish Americans | 0.2 /100 | #267 | Tragic 6.2% |
| Alaska Natives | 0.2 /100 | #268 | Tragic 6.2% |
| Immigrants from West Indies | 0.1 /100 | #269 | Tragic 6.2% |
| Immigrants from Jamaica | 0.1 /100 | #270 | Tragic 6.2% |
| Immigrants from Bahamas | 0.1 /100 | #271 | Tragic 6.2% |
| Trinidadians and Tobagonians | 0.1 /100 | #272 | Tragic 6.2% |
| Colville | 0.1 /100 | #273 | Tragic 6.3% |
Creek Married-Couple Family Poverty Correlation Summary
| Measurement | Creek Data | Married-Couple Family Poverty Data |
| Minimum | 0.037% | 0.52% |
| Maximum | 38.3% | 34.7% |
| Range | 38.2% | 34.2% |
| Mean | 10.0% | 8.8% |
| Median | 7.6% | 7.1% |
| Interquartile 25% (IQ1) | 3.7% | 5.5% |
| Interquartile 75% (IQ3) | 14.7% | 10.3% |
| Interquartile Range (IQR) | 11.0% | 4.8% |
| Standard Deviation (Sample) | 8.4% | 5.9% |
| Standard Deviation (Population) | 8.4% | 5.8% |
Correlation Details
| Creek Percentile | Sample Size | Married-Couple Family Poverty |
[ 0.0% - 0.5% ] 0.037% | 165,328,391 | 5.4% |
[ 0.0% - 0.5% ] 0.31% | 5,359,490 | 5.3% |
[ 0.5% - 1.0% ] 0.57% | 2,535,378 | 5.7% |
[ 0.5% - 1.0% ] 0.75% | 1,099,562 | 6.2% |
[ 0.5% - 1.0% ] 1.00% | 543,125 | 6.0% |
[ 1.0% - 1.5% ] 1.21% | 552,962 | 5.3% |
[ 1.0% - 1.5% ] 1.48% | 410,653 | 4.7% |
[ 1.5% - 2.0% ] 1.69% | 542,280 | 6.6% |
[ 1.5% - 2.0% ] 1.93% | 431,446 | 6.2% |
[ 2.0% - 2.5% ] 2.13% | 81,695 | 7.0% |
[ 2.0% - 2.5% ] 2.33% | 121,625 | 7.1% |
[ 2.5% - 3.0% ] 2.55% | 104,075 | 9.3% |
[ 2.5% - 3.0% ] 2.76% | 149,138 | 5.4% |
[ 3.0% - 3.5% ] 3.02% | 24,270 | 8.7% |
[ 3.0% - 3.5% ] 3.19% | 62,394 | 3.4% |
[ 3.0% - 3.5% ] 3.44% | 47,842 | 8.0% |
[ 3.5% - 4.0% ] 3.71% | 21,260 | 5.5% |
[ 3.5% - 4.0% ] 3.88% | 60,289 | 9.1% |
[ 4.0% - 4.5% ] 4.13% | 8,894 | 10.8% |
[ 4.0% - 4.5% ] 4.32% | 30,498 | 11.7% |
[ 4.5% - 5.0% ] 4.59% | 33,681 | 7.9% |
[ 4.5% - 5.0% ] 4.71% | 24,139 | 3.9% |
[ 5.0% - 5.5% ] 5.23% | 7,043 | 6.3% |
[ 5.0% - 5.5% ] 5.44% | 23,323 | 5.2% |
[ 5.5% - 6.0% ] 5.64% | 2,996 | 6.9% |
[ 5.5% - 6.0% ] 5.94% | 758 | 11.0% |
[ 6.0% - 6.5% ] 6.10% | 164 | 34.7% |
[ 6.0% - 6.5% ] 6.34% | 1,262 | 10.3% |
[ 6.5% - 7.0% ] 6.59% | 42,122 | 7.1% |
[ 6.5% - 7.0% ] 6.74% | 21,001 | 8.1% |
[ 7.0% - 7.5% ] 7.03% | 20,278 | 6.6% |
[ 7.0% - 7.5% ] 7.17% | 17,879 | 5.7% |
[ 7.0% - 7.5% ] 7.48% | 15,295 | 10.3% |
[ 7.5% - 8.0% ] 7.64% | 7,093 | 3.2% |
[ 7.5% - 8.0% ] 7.94% | 17,346 | 10.6% |
[ 8.0% - 8.5% ] 8.13% | 2,867 | 2.2% |
[ 8.0% - 8.5% ] 8.33% | 1,393 | 18.6% |
[ 8.5% - 9.0% ] 8.62% | 2,934 | 5.7% |
[ 8.5% - 9.0% ] 8.89% | 2,869 | 7.1% |
[ 9.0% - 9.5% ] 9.02% | 1,286 | 4.6% |
[ 9.0% - 9.5% ] 9.49% | 2,572 | 5.7% |
[ 10.0% - 10.5% ] 10.13% | 9,131 | 9.3% |
[ 10.0% - 10.5% ] 10.41% | 3,181 | 6.7% |
[ 10.0% - 10.5% ] 10.49% | 143 | 8.3% |
[ 10.5% - 11.0% ] 10.73% | 5,639 | 9.1% |
[ 11.0% - 11.5% ] 11.18% | 152 | 2.4% |
[ 12.0% - 12.5% ] 12.33% | 15,212 | 8.2% |
[ 12.5% - 13.0% ] 12.80% | 1,086 | 5.8% |
[ 13.0% - 13.5% ] 13.11% | 11,366 | 10.2% |
[ 13.5% - 14.0% ] 13.70% | 9,264 | 7.7% |
[ 14.5% - 15.0% ] 14.75% | 373 | 25.0% |
[ 15.0% - 15.5% ] 15.46% | 2,419 | 16.0% |
[ 15.5% - 16.0% ] 15.65% | 3,048 | 0.52% |
[ 15.5% - 16.0% ] 15.98% | 2,828 | 3.8% |
[ 16.0% - 16.5% ] 16.27% | 375 | 5.6% |
[ 18.0% - 18.5% ] 18.18% | 55 | 23.1% |
[ 18.0% - 18.5% ] 18.29% | 328 | 7.6% |
[ 20.0% - 20.5% ] 20.36% | 894 | 6.6% |
[ 21.0% - 21.5% ] 21.15% | 6,000 | 12.1% |
[ 21.5% - 22.0% ] 21.76% | 763 | 14.9% |
[ 23.0% - 23.5% ] 23.27% | 739 | 7.1% |
[ 23.5% - 24.0% ] 23.65% | 3,078 | 16.0% |
[ 24.0% - 24.5% ] 24.41% | 1,815 | 5.4% |
[ 24.5% - 25.0% ] 24.86% | 1,070 | 12.8% |
[ 30.5% - 31.0% ] 30.85% | 2,480 | 4.9% |
[ 31.5% - 32.0% ] 31.77% | 447 | 26.7% |
[ 38.0% - 38.5% ] 38.25% | 1,498 | 12.7% |