Immigrants from South America Married-Couple Family Poverty
COMPARE
Immigrants from South America
Select to Compare
Married-Couple Family Poverty
Immigrants from South America Married-Couple Family Poverty
5.7%
POVERTY | MARRIED-COUPLE FAMILIES
3.1/ 100
METRIC RATING
237th/ 347
METRIC RANK
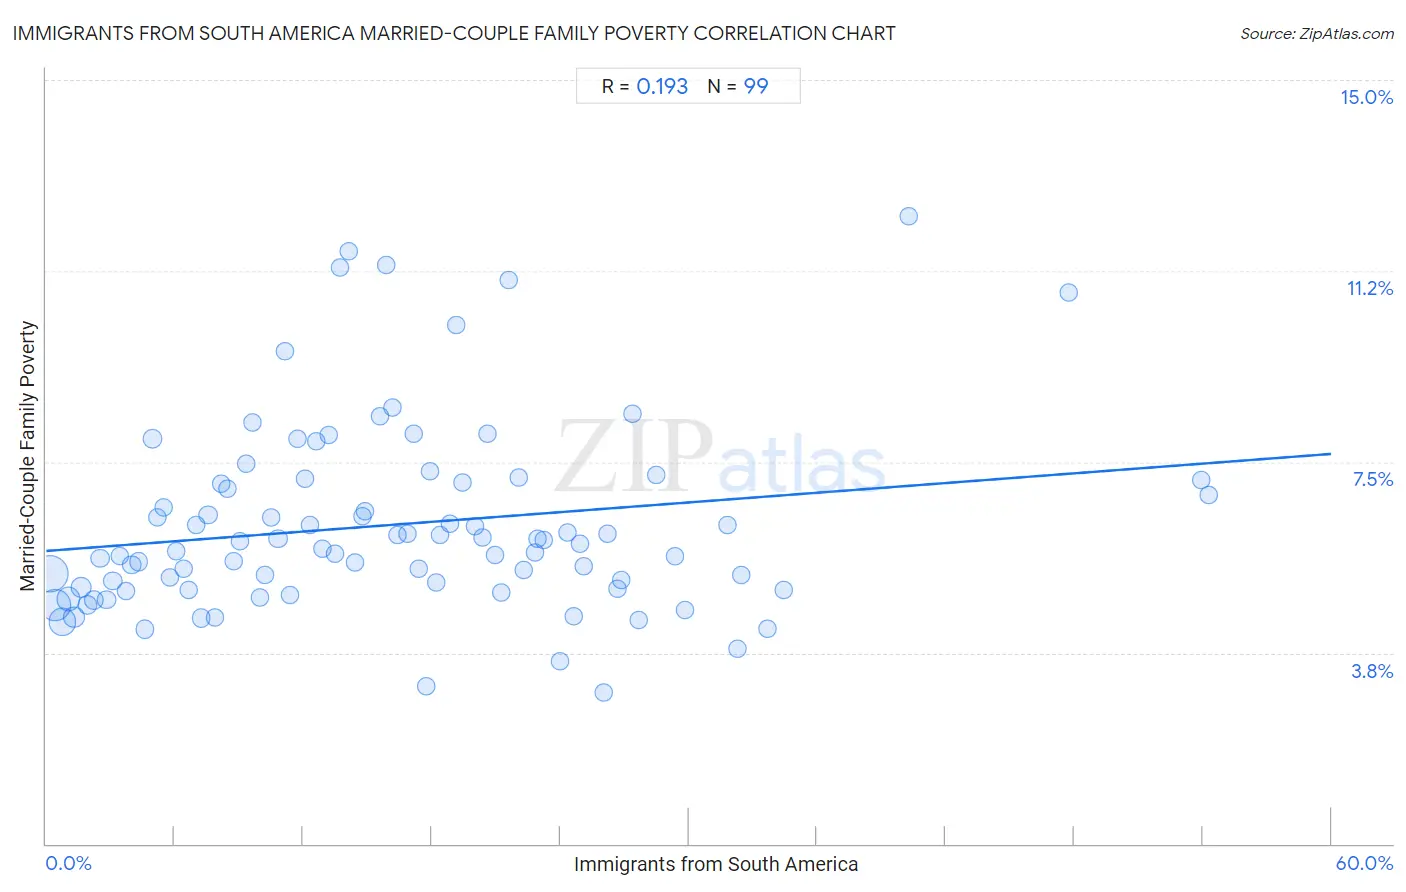
Immigrants from South America Married-Couple Family Poverty Correlation Chart
The statistical analysis conducted on geographies consisting of 479,571,466 people shows a poor positive correlation between the proportion of Immigrants from South America and poverty level among married-couple families in the United States with a correlation coefficient (R) of 0.193 and weighted average of 5.7%. On average, for every 1% (one percent) increase in Immigrants from South America within a typical geography, there is an increase of 0.032% in poverty level among married-couple families.
It is essential to understand that the correlation between the percentage of Immigrants from South America and poverty level among married-couple families does not imply a direct cause-and-effect relationship. It remains uncertain whether the presence of Immigrants from South America influences an upward or downward trend in the level of poverty level among married-couple families within an area, or if Immigrants from South America simply ended up residing in those areas with higher or lower levels of poverty level among married-couple families due to other factors.
Demographics Similar to Immigrants from South America by Married-Couple Family Poverty
In terms of married-couple family poverty, the demographic groups most similar to Immigrants from South America are Ghanaian (5.7%, a difference of 0.16%), Immigrants from Sudan (5.7%, a difference of 0.32%), Cherokee (5.8%, a difference of 0.38%), Venezuelan (5.8%, a difference of 0.40%), and Immigrants from Uruguay (5.7%, a difference of 0.50%).
| Demographics | Rating | Rank | Married-Couple Family Poverty |
| Moroccans | 4.9 /100 | #230 | Tragic 5.7% |
| Immigrants from Iraq | 4.4 /100 | #231 | Tragic 5.7% |
| Immigrants from Laos | 4.4 /100 | #232 | Tragic 5.7% |
| Immigrants from Colombia | 3.7 /100 | #233 | Tragic 5.7% |
| Immigrants from Uruguay | 3.7 /100 | #234 | Tragic 5.7% |
| Immigrants from Sudan | 3.5 /100 | #235 | Tragic 5.7% |
| Ghanaians | 3.3 /100 | #236 | Tragic 5.7% |
| Immigrants from South America | 3.1 /100 | #237 | Tragic 5.7% |
| Cherokee | 2.7 /100 | #238 | Tragic 5.8% |
| Venezuelans | 2.7 /100 | #239 | Tragic 5.8% |
| Fijians | 2.5 /100 | #240 | Tragic 5.8% |
| Immigrants from Panama | 2.5 /100 | #241 | Tragic 5.8% |
| Immigrants from Western Africa | 2.4 /100 | #242 | Tragic 5.8% |
| Somalis | 2.3 /100 | #243 | Tragic 5.8% |
| Chickasaw | 2.3 /100 | #244 | Tragic 5.8% |
Immigrants from South America Married-Couple Family Poverty Correlation Summary
| Measurement | Immigrants from South America Data | Married-Couple Family Poverty Data |
| Minimum | 0.15% | 3.0% |
| Maximum | 54.3% | 12.3% |
| Range | 54.1% | 9.4% |
| Mean | 16.2% | 6.3% |
| Median | 14.7% | 5.9% |
| Interquartile 25% (IQ1) | 7.2% | 5.0% |
| Interquartile 75% (IQ3) | 22.9% | 7.1% |
| Interquartile Range (IQR) | 15.7% | 2.1% |
| Standard Deviation (Sample) | 11.3% | 1.9% |
| Standard Deviation (Population) | 11.3% | 1.9% |
Correlation Details
| Immigrants from South America Percentile | Sample Size | Married-Couple Family Poverty |
[ 0.0% - 0.5% ] 0.15% | 140,314,472 | 5.3% |
[ 0.0% - 0.5% ] 0.43% | 102,206,931 | 4.7% |
[ 0.5% - 1.0% ] 0.74% | 67,201,147 | 4.4% |
[ 1.0% - 1.5% ] 1.04% | 43,008,988 | 4.8% |
[ 1.0% - 1.5% ] 1.31% | 23,457,847 | 4.5% |
[ 1.5% - 2.0% ] 1.63% | 19,997,510 | 5.0% |
[ 1.5% - 2.0% ] 1.93% | 10,354,456 | 4.7% |
[ 2.0% - 2.5% ] 2.23% | 8,619,576 | 4.8% |
[ 2.5% - 3.0% ] 2.51% | 7,203,975 | 5.6% |
[ 2.5% - 3.0% ] 2.81% | 4,411,453 | 4.8% |
[ 3.0% - 3.5% ] 3.11% | 5,221,482 | 5.2% |
[ 3.0% - 3.5% ] 3.42% | 3,368,710 | 5.7% |
[ 3.5% - 4.0% ] 3.72% | 3,753,069 | 5.0% |
[ 3.5% - 4.0% ] 4.00% | 2,596,155 | 5.5% |
[ 4.0% - 4.5% ] 4.32% | 2,515,528 | 5.5% |
[ 4.5% - 5.0% ] 4.61% | 1,948,766 | 4.2% |
[ 4.5% - 5.0% ] 4.98% | 9,692,203 | 8.0% |
[ 5.0% - 5.5% ] 5.19% | 2,133,387 | 6.4% |
[ 5.0% - 5.5% ] 5.49% | 1,360,480 | 6.6% |
[ 5.5% - 6.0% ] 5.77% | 1,234,758 | 5.2% |
[ 6.0% - 6.5% ] 6.08% | 915,797 | 5.7% |
[ 6.0% - 6.5% ] 6.40% | 608,336 | 5.4% |
[ 6.5% - 7.0% ] 6.65% | 1,073,024 | 5.0% |
[ 6.5% - 7.0% ] 6.97% | 786,079 | 6.3% |
[ 7.0% - 7.5% ] 7.24% | 636,156 | 4.4% |
[ 7.5% - 8.0% ] 7.56% | 744,340 | 6.5% |
[ 7.5% - 8.0% ] 7.85% | 458,853 | 4.4% |
[ 8.0% - 8.5% ] 8.16% | 705,601 | 7.1% |
[ 8.0% - 8.5% ] 8.45% | 676,720 | 7.0% |
[ 8.5% - 9.0% ] 8.75% | 608,879 | 5.5% |
[ 9.0% - 9.5% ] 9.02% | 476,352 | 5.9% |
[ 9.0% - 9.5% ] 9.36% | 699,024 | 7.5% |
[ 9.5% - 10.0% ] 9.64% | 308,506 | 8.3% |
[ 9.5% - 10.0% ] 9.95% | 572,485 | 4.8% |
[ 10.0% - 10.5% ] 10.24% | 460,392 | 5.3% |
[ 10.5% - 11.0% ] 10.53% | 627,934 | 6.4% |
[ 10.5% - 11.0% ] 10.83% | 604,978 | 6.0% |
[ 11.0% - 11.5% ] 11.13% | 762,305 | 9.7% |
[ 11.0% - 11.5% ] 11.38% | 264,247 | 4.9% |
[ 11.5% - 12.0% ] 11.73% | 181,263 | 8.0% |
[ 12.0% - 12.5% ] 12.07% | 125,446 | 7.2% |
[ 12.0% - 12.5% ] 12.33% | 352,769 | 6.3% |
[ 12.5% - 13.0% ] 12.60% | 69,299 | 7.9% |
[ 12.5% - 13.0% ] 12.88% | 621,821 | 5.8% |
[ 13.0% - 13.5% ] 13.17% | 595,425 | 8.0% |
[ 13.0% - 13.5% ] 13.50% | 398,626 | 5.7% |
[ 13.5% - 14.0% ] 13.74% | 97,756 | 11.3% |
[ 14.0% - 14.5% ] 14.15% | 20,322 | 11.6% |
[ 14.0% - 14.5% ] 14.43% | 178,189 | 5.5% |
[ 14.5% - 15.0% ] 14.74% | 365,630 | 6.4% |
[ 14.5% - 15.0% ] 14.90% | 200,070 | 6.5% |
[ 15.5% - 16.0% ] 15.59% | 161,299 | 8.4% |
[ 15.5% - 16.0% ] 15.90% | 158,663 | 11.4% |
[ 16.0% - 16.5% ] 16.15% | 397,885 | 8.6% |
[ 16.0% - 16.5% ] 16.39% | 197,932 | 6.1% |
[ 16.5% - 17.0% ] 16.85% | 128,146 | 6.1% |
[ 17.0% - 17.5% ] 17.15% | 173,635 | 8.1% |
[ 17.0% - 17.5% ] 17.39% | 143,078 | 5.4% |
[ 17.5% - 18.0% ] 17.72% | 34,922 | 3.1% |
[ 17.5% - 18.0% ] 17.93% | 116,285 | 7.3% |
[ 18.0% - 18.5% ] 18.22% | 13,503 | 5.1% |
[ 18.0% - 18.5% ] 18.41% | 79,484 | 6.1% |
[ 18.5% - 19.0% ] 18.84% | 141,348 | 6.3% |
[ 19.0% - 19.5% ] 19.16% | 199,419 | 10.2% |
[ 19.0% - 19.5% ] 19.42% | 288,403 | 7.1% |
[ 19.5% - 20.0% ] 19.99% | 65,589 | 6.2% |
[ 20.0% - 20.5% ] 20.36% | 33,160 | 6.0% |
[ 20.5% - 21.0% ] 20.62% | 92,945 | 8.0% |
[ 20.5% - 21.0% ] 20.93% | 117,896 | 5.7% |
[ 21.0% - 21.5% ] 21.26% | 69,714 | 4.9% |
[ 21.5% - 22.0% ] 21.59% | 117,157 | 11.1% |
[ 22.0% - 22.5% ] 22.04% | 99,813 | 7.2% |
[ 22.0% - 22.5% ] 22.28% | 2,419 | 5.4% |
[ 22.5% - 23.0% ] 22.80% | 89,531 | 5.7% |
[ 22.5% - 23.0% ] 22.94% | 9,176 | 6.0% |
[ 23.0% - 23.5% ] 23.23% | 57,066 | 6.0% |
[ 24.0% - 24.5% ] 24.01% | 17,136 | 3.6% |
[ 24.0% - 24.5% ] 24.32% | 21,935 | 6.1% |
[ 24.5% - 25.0% ] 24.63% | 35,967 | 4.5% |
[ 24.5% - 25.0% ] 24.91% | 15,184 | 5.9% |
[ 25.0% - 25.5% ] 25.12% | 45,457 | 5.5% |
[ 26.0% - 26.5% ] 26.05% | 11,809 | 3.0% |
[ 26.0% - 26.5% ] 26.23% | 42,058 | 6.1% |
[ 26.5% - 27.0% ] 26.68% | 40,106 | 5.0% |
[ 26.5% - 27.0% ] 26.82% | 44,742 | 5.2% |
[ 27.0% - 27.5% ] 27.39% | 16,450 | 8.4% |
[ 27.5% - 28.0% ] 27.68% | 32,881 | 4.4% |
[ 28.0% - 28.5% ] 28.47% | 548 | 7.2% |
[ 29.0% - 29.5% ] 29.39% | 51,153 | 5.6% |
[ 29.5% - 30.0% ] 29.82% | 23,734 | 4.6% |
[ 31.5% - 32.0% ] 31.82% | 5,843 | 6.3% |
[ 32.0% - 32.5% ] 32.25% | 17,450 | 3.8% |
[ 32.0% - 32.5% ] 32.43% | 16,333 | 5.3% |
[ 33.5% - 34.0% ] 33.70% | 99,543 | 4.2% |
[ 34.0% - 34.5% ] 34.45% | 48,096 | 5.0% |
[ 40.0% - 40.5% ] 40.26% | 56,696 | 12.3% |
[ 47.5% - 48.0% ] 47.76% | 2,718 | 10.8% |
[ 53.5% - 54.0% ] 53.91% | 64,751 | 7.1% |
[ 54.0% - 54.5% ] 54.26% | 74,891 | 6.8% |