Immigrants from China Married-Couple Family Poverty
COMPARE
Immigrants from China
Select to Compare
Married-Couple Family Poverty
Immigrants from China Married-Couple Family Poverty
5.0%
POVERTY | MARRIED-COUPLE FAMILIES
84.6/ 100
METRIC RATING
142nd/ 347
METRIC RANK
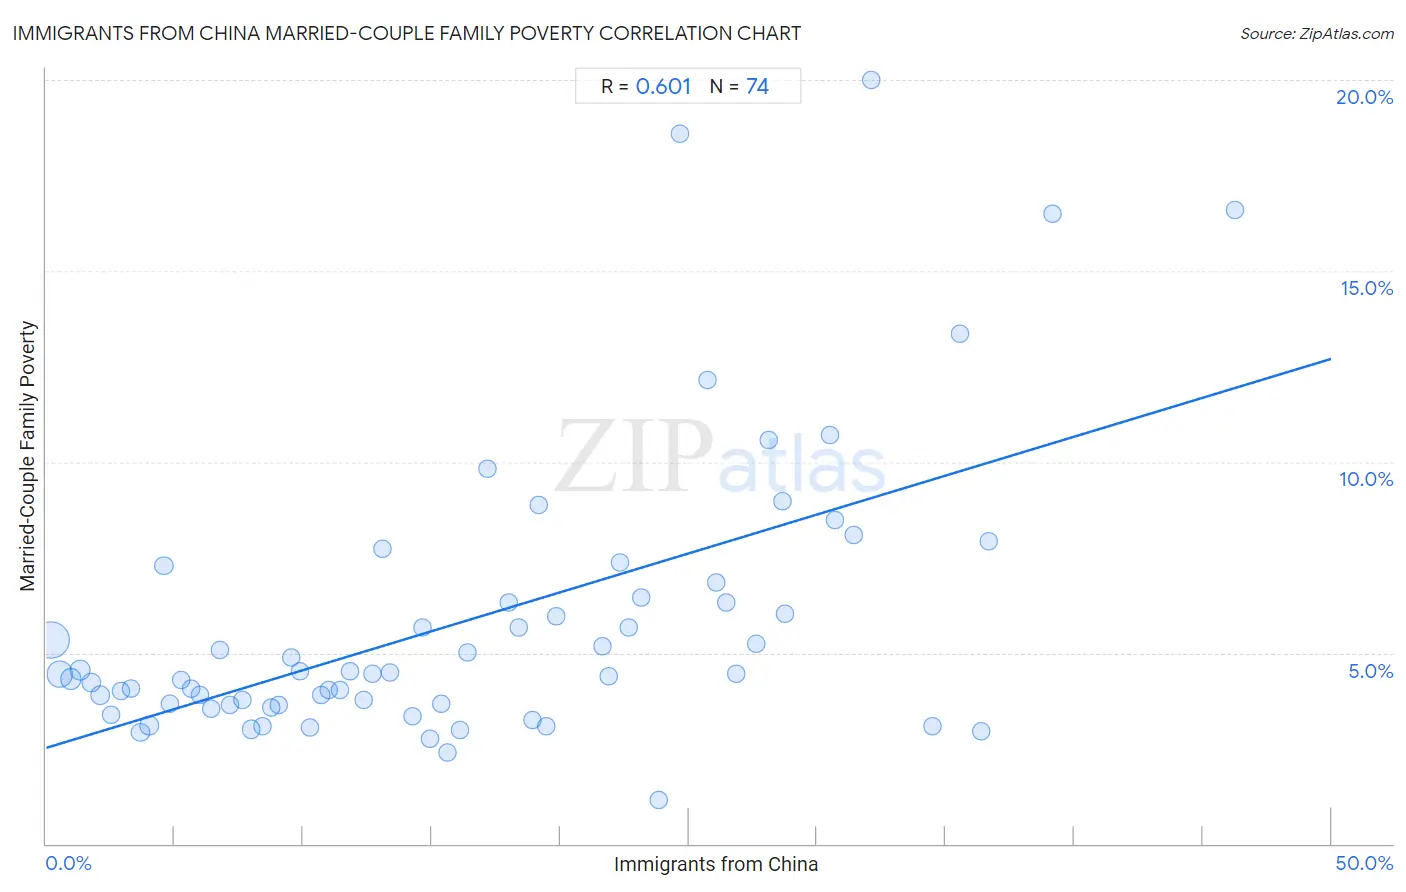
Immigrants from China Married-Couple Family Poverty Correlation Chart
The statistical analysis conducted on geographies consisting of 451,197,331 people shows a significant positive correlation between the proportion of Immigrants from China and poverty level among married-couple families in the United States with a correlation coefficient (R) of 0.601 and weighted average of 5.0%. On average, for every 1% (one percent) increase in Immigrants from China within a typical geography, there is an increase of 0.20% in poverty level among married-couple families.
It is essential to understand that the correlation between the percentage of Immigrants from China and poverty level among married-couple families does not imply a direct cause-and-effect relationship. It remains uncertain whether the presence of Immigrants from China influences an upward or downward trend in the level of poverty level among married-couple families within an area, or if Immigrants from China simply ended up residing in those areas with higher or lower levels of poverty level among married-couple families due to other factors.
Demographics Similar to Immigrants from China by Married-Couple Family Poverty
In terms of married-couple family poverty, the demographic groups most similar to Immigrants from China are Immigrants from Brazil (5.0%, a difference of 0.0%), Immigrants from Portugal (5.0%, a difference of 0.050%), German Russian (5.0%, a difference of 0.11%), Immigrants from Egypt (5.0%, a difference of 0.27%), and Hmong (5.0%, a difference of 0.32%).
| Demographics | Rating | Rank | Married-Couple Family Poverty |
| Assyrians/Chaldeans/Syriacs | 89.4 /100 | #135 | Excellent 4.9% |
| Immigrants from Hungary | 88.7 /100 | #136 | Excellent 4.9% |
| Guamanians/Chamorros | 86.5 /100 | #137 | Excellent 4.9% |
| Chileans | 86.0 /100 | #138 | Excellent 4.9% |
| German Russians | 85.1 /100 | #139 | Excellent 5.0% |
| Immigrants from Portugal | 84.8 /100 | #140 | Excellent 5.0% |
| Immigrants from Brazil | 84.6 /100 | #141 | Excellent 5.0% |
| Immigrants from China | 84.6 /100 | #142 | Excellent 5.0% |
| Immigrants from Egypt | 83.4 /100 | #143 | Excellent 5.0% |
| Hmong | 83.2 /100 | #144 | Excellent 5.0% |
| Immigrants from Spain | 79.9 /100 | #145 | Good 5.0% |
| Mongolians | 79.8 /100 | #146 | Good 5.0% |
| Syrians | 78.7 /100 | #147 | Good 5.0% |
| Immigrants from Russia | 78.7 /100 | #148 | Good 5.0% |
| Immigrants from Oceania | 78.6 /100 | #149 | Good 5.0% |
Immigrants from China Married-Couple Family Poverty Correlation Summary
| Measurement | Immigrants from China Data | Married-Couple Family Poverty Data |
| Minimum | 0.17% | 1.1% |
| Maximum | 46.3% | 20.0% |
| Range | 46.1% | 18.9% |
| Mean | 16.3% | 5.8% |
| Median | 14.8% | 4.5% |
| Interquartile 25% (IQ1) | 7.2% | 3.6% |
| Interquartile 75% (IQ3) | 24.7% | 6.5% |
| Interquartile Range (IQR) | 17.5% | 2.8% |
| Standard Deviation (Sample) | 11.0% | 3.7% |
| Standard Deviation (Population) | 11.0% | 3.7% |
Correlation Details
| Immigrants from China Percentile | Sample Size | Married-Couple Family Poverty |
[ 0.0% - 0.5% ] 0.17% | 218,512,772 | 5.4% |
[ 0.5% - 1.0% ] 0.54% | 92,346,147 | 4.4% |
[ 0.5% - 1.0% ] 0.95% | 37,985,743 | 4.3% |
[ 1.0% - 1.5% ] 1.33% | 24,891,547 | 4.6% |
[ 1.5% - 2.0% ] 1.73% | 13,669,317 | 4.2% |
[ 2.0% - 2.5% ] 2.10% | 10,133,927 | 3.9% |
[ 2.5% - 3.0% ] 2.52% | 5,040,001 | 3.4% |
[ 2.5% - 3.0% ] 2.91% | 5,775,407 | 4.0% |
[ 3.0% - 3.5% ] 3.29% | 5,043,805 | 4.1% |
[ 3.5% - 4.0% ] 3.67% | 3,055,896 | 2.9% |
[ 4.0% - 4.5% ] 4.01% | 2,747,945 | 3.1% |
[ 4.5% - 5.0% ] 4.58% | 11,829,197 | 7.3% |
[ 4.5% - 5.0% ] 4.83% | 1,624,336 | 3.7% |
[ 5.0% - 5.5% ] 5.23% | 1,079,682 | 4.3% |
[ 5.5% - 6.0% ] 5.64% | 2,238,057 | 4.1% |
[ 6.0% - 6.5% ] 6.00% | 697,474 | 3.9% |
[ 6.0% - 6.5% ] 6.40% | 1,081,258 | 3.5% |
[ 6.5% - 7.0% ] 6.77% | 1,048,717 | 5.1% |
[ 7.0% - 7.5% ] 7.15% | 1,033,525 | 3.6% |
[ 7.5% - 8.0% ] 7.62% | 689,696 | 3.8% |
[ 7.5% - 8.0% ] 7.99% | 977,509 | 3.0% |
[ 8.0% - 8.5% ] 8.40% | 880,874 | 3.1% |
[ 8.5% - 9.0% ] 8.77% | 336,461 | 3.6% |
[ 9.0% - 9.5% ] 9.04% | 670,744 | 3.6% |
[ 9.5% - 10.0% ] 9.56% | 422,978 | 4.9% |
[ 9.5% - 10.0% ] 9.88% | 603,207 | 4.5% |
[ 10.0% - 10.5% ] 10.25% | 244,554 | 3.1% |
[ 10.5% - 11.0% ] 10.70% | 345,913 | 3.9% |
[ 10.5% - 11.0% ] 10.99% | 428,607 | 4.0% |
[ 11.0% - 11.5% ] 11.41% | 531,320 | 4.0% |
[ 11.5% - 12.0% ] 11.81% | 162,488 | 4.5% |
[ 12.0% - 12.5% ] 12.35% | 1,056,987 | 3.8% |
[ 12.5% - 13.0% ] 12.68% | 374,088 | 4.5% |
[ 13.0% - 13.5% ] 13.07% | 268,571 | 7.7% |
[ 13.0% - 13.5% ] 13.39% | 346,327 | 4.5% |
[ 14.0% - 14.5% ] 14.27% | 47,202 | 3.3% |
[ 14.5% - 15.0% ] 14.63% | 96,124 | 5.7% |
[ 14.5% - 15.0% ] 14.93% | 110,434 | 2.8% |
[ 15.0% - 15.5% ] 15.39% | 40,627 | 3.7% |
[ 15.5% - 16.0% ] 15.59% | 744 | 2.4% |
[ 16.0% - 16.5% ] 16.11% | 183,427 | 3.0% |
[ 16.0% - 16.5% ] 16.38% | 51,894 | 5.0% |
[ 17.0% - 17.5% ] 17.18% | 134,419 | 9.8% |
[ 18.0% - 18.5% ] 18.02% | 111,247 | 6.3% |
[ 18.0% - 18.5% ] 18.40% | 312,200 | 5.6% |
[ 18.5% - 19.0% ] 18.92% | 113,241 | 3.3% |
[ 19.0% - 19.5% ] 19.18% | 235,005 | 8.9% |
[ 19.0% - 19.5% ] 19.44% | 45,650 | 3.1% |
[ 19.5% - 20.0% ] 19.85% | 131,923 | 6.0% |
[ 21.5% - 22.0% ] 21.65% | 89,075 | 5.2% |
[ 21.5% - 22.0% ] 21.87% | 143,740 | 4.4% |
[ 22.0% - 22.5% ] 22.31% | 102,223 | 7.4% |
[ 22.5% - 23.0% ] 22.68% | 85,306 | 5.7% |
[ 23.0% - 23.5% ] 23.13% | 24,169 | 6.5% |
[ 23.5% - 24.0% ] 23.82% | 1,100 | 1.1% |
[ 24.5% - 25.0% ] 24.66% | 80,986 | 18.6% |
[ 25.5% - 26.0% ] 25.74% | 134,385 | 12.1% |
[ 26.0% - 26.5% ] 26.09% | 151,983 | 6.8% |
[ 26.0% - 26.5% ] 26.46% | 28,212 | 6.3% |
[ 26.5% - 27.0% ] 26.87% | 68,923 | 4.4% |
[ 27.5% - 28.0% ] 27.63% | 36,165 | 5.2% |
[ 28.0% - 28.5% ] 28.13% | 37,340 | 10.6% |
[ 28.5% - 29.0% ] 28.66% | 52,268 | 9.0% |
[ 28.5% - 29.0% ] 28.73% | 87,947 | 6.0% |
[ 30.5% - 31.0% ] 30.51% | 25,460 | 10.7% |
[ 30.5% - 31.0% ] 30.69% | 60,386 | 8.5% |
[ 31.0% - 31.5% ] 31.42% | 557 | 8.1% |
[ 32.0% - 32.5% ] 32.09% | 430 | 20.0% |
[ 34.5% - 35.0% ] 34.51% | 1,107 | 3.1% |
[ 35.5% - 36.0% ] 35.57% | 12,070 | 13.4% |
[ 36.0% - 36.5% ] 36.36% | 25,001 | 2.9% |
[ 36.5% - 37.0% ] 36.69% | 26,418 | 7.9% |
[ 39.0% - 39.5% ] 39.16% | 53,371 | 16.5% |
[ 46.0% - 46.5% ] 46.27% | 79,495 | 16.6% |