Icelander Married-Couple Family Poverty

COMPARE

Icelander
Race
Ancestry
AfghanAfricanAlaska NativeAlaskan AthabascanAlbanianAleutAlsatianAmericanApacheArabArapahoArgentineanArmenianAssyrian/Chaldean/SyriacAustralianAustrianBahamianBangladeshiBarbadianBasqueBelgianBelizeanBermudanBhutaneseBlackfeetBolivianBrazilianBritishBritish West IndianBulgarianBurmeseCajunCambodianCanadianCape VerdeanCarpatho RusynCelticCentral AmericanCentral American IndianCherokeeCheyenneChickasawChileanChineseChippewaChoctawColombianColvilleComancheCosta RicanCreeCreekCroatianCrowCubanCypriotCzechCzechoslovakianDanishDelawareDominicanDutchDutch West IndianEastern EuropeanEcuadorianEgyptianEnglishEstonianEthiopianEuropeanFijianFilipinoFinnishFrenchFrench American IndianFrench CanadianGermanGerman RussianGhanaianGreekGuamanian/ChamorroGuatemalanGuyaneseHaitianHmongHonduranHopiHoumaHungarianIcelanderIndian (Asian)IndonesianInupiatIranianIraqiIrishIroquoisIsraeliItalianJamaicanJapaneseJordanianKenyanKiowaKoreanLaotianLatvianLebaneseLiberianLithuanianLumbeeLuxembourgerMacedonianMalaysianMalteseMarshalleseMenomineeMexicanMexican American IndianMongolianMoroccanNative HawaiianNavajoNepaleseNew ZealanderNicaraguanNigerianNorthern EuropeanNorwegianOkinawanOsageOttawaPaiutePakistaniPalestinianPanamanianParaguayanPennsylvania GermanPeruvianPimaPolishPortuguesePotawatomiPuebloPuerto RicanPuget Sound SalishRomanianRussianSalvadoranSamoanScandinavianScotch-IrishScottishSeminoleSenegaleseSerbianShoshoneSierra LeoneanSiouxSlavicSlovakSloveneSomaliSouth AfricanSouth AmericanSouth American IndianSoviet UnionSpaniardSpanishSpanish AmericanSpanish American IndianSri LankanSubsaharan AfricanSudaneseSwedishSwissSyrianTaiwaneseThaiTlingit-HaidaTohono O'OdhamTonganTrinidadian and TobagonianTsimshianTurkishU.S. Virgin IslanderUgandanUkrainianUruguayanUteVenezuelanVietnameseWelshWest IndianYakamaYaquiYugoslavianYumanYup'ikZimbabwean
Immigration
NonimmigrantsImmigrantsAfghanistanAfricaAlbaniaArgentinaArmeniaAsiaAustraliaAustriaBahamasBangladeshBarbadosBelarusBelgiumBelizeBoliviaBosnia and HerzegovinaBrazilBulgariaBurma/MyanmarCabo VerdeCambodiaCameroonCanadaCaribbeanCentral AmericaChileChinaColombiaCongoCosta RicaCroatiaCubaCzechoslovakiaDenmarkDominicaDominican RepublicEastern AfricaEastern AsiaEastern EuropeEcuadorEgyptEl SalvadorEnglandEritreaEthiopiaEuropeFijiFranceGermanyGhanaGreeceGrenadaGuatemalaGuyanaHaitiHondurasHong KongHungaryIndiaIndonesiaIranIraqIrelandIsraelItalyJamaicaJapanJordanKazakhstanKenyaKoreaKuwaitLaosLatin AmericaLatviaLebanonLiberiaLithuaniaMalaysiaMexicoMicronesiaMiddle AfricaMoldovaMoroccoNepalNetherlandsNicaraguaNigeriaNorth AmericaNorth MacedoniaNorthern AfricaNorthern EuropeNorwayOceaniaPakistanPanamaPeruPhilippinesPolandPortugalRomaniaRussiaSaudi ArabiaScotlandSenegalSerbiaSierra LeoneSingaporeSomaliaSouth AfricaSouth AmericaSouth Central AsiaSouth Eastern AsiaSouthern EuropeSpainSri LankaSt. Vincent and the GrenadinesSudanSwedenSwitzerlandSyriaTaiwanThailandTrinidad and TobagoTurkeyUgandaUkraineUruguayUzbekistanVenezuelaVietnamWest IndiesWestern AfricaWestern AsiaWestern EuropeYemenZaireZimbabweAzores
Select to Compare
Race
Ancestry
AfghanAfricanAlaska NativeAlaskan AthabascanAlbanianAleutAlsatianAmericanApacheArabArapahoArgentineanArmenianAssyrian/Chaldean/SyriacAustralianAustrianBahamianBangladeshiBarbadianBasqueBelgianBelizeanBermudanBhutaneseBlackfeetBolivianBrazilianBritishBritish West IndianBulgarianBurmeseCajunCambodianCanadianCape VerdeanCarpatho RusynCelticCentral AmericanCentral American IndianCherokeeCheyenneChickasawChileanChineseChippewaChoctawColombianColvilleComancheCosta RicanCreeCreekCroatianCrowCubanCypriotCzechCzechoslovakianDanishDelawareDominicanDutchDutch West IndianEastern EuropeanEcuadorianEgyptianEnglishEstonianEthiopianEuropeanFijianFilipinoFinnishFrenchFrench American IndianFrench CanadianGermanGerman RussianGhanaianGreekGuamanian/ChamorroGuatemalanGuyaneseHaitianHmongHonduranHopiHoumaHungarianIndian (Asian)IndonesianInupiatIranianIraqiIrishIroquoisIsraeliItalianJamaicanJapaneseJordanianKenyanKiowaKoreanLaotianLatvianLebaneseLiberianLithuanianLumbeeLuxembourgerMacedonianMalaysianMalteseMarshalleseMenomineeMexicanMexican American IndianMongolianMoroccanNative HawaiianNavajoNepaleseNew ZealanderNicaraguanNigerianNorthern EuropeanNorwegianOkinawanOsageOttawaPaiutePakistaniPalestinianPanamanianParaguayanPennsylvania GermanPeruvianPimaPolishPortuguesePotawatomiPuebloPuerto RicanPuget Sound SalishRomanianRussianSalvadoranSamoanScandinavianScotch-IrishScottishSeminoleSenegaleseSerbianShoshoneSierra LeoneanSiouxSlavicSlovakSloveneSomaliSouth AfricanSouth AmericanSouth American IndianSoviet UnionSpaniardSpanishSpanish AmericanSpanish American IndianSri LankanSubsaharan AfricanSudaneseSwedishSwissSyrianTaiwaneseThaiTlingit-HaidaTohono O'OdhamTonganTrinidadian and TobagonianTsimshianTurkishU.S. Virgin IslanderUgandanUkrainianUruguayanUteVenezuelanVietnameseWelshWest IndianYakamaYaquiYugoslavianYumanYup'ikZimbabwean
Immigration
NonimmigrantsImmigrantsAfghanistanAfricaAlbaniaArgentinaArmeniaAsiaAustraliaAustriaBahamasBangladeshBarbadosBelarusBelgiumBelizeBoliviaBosnia and HerzegovinaBrazilBulgariaBurma/MyanmarCabo VerdeCambodiaCameroonCanadaCaribbeanCentral AmericaChileChinaColombiaCongoCosta RicaCroatiaCubaCzechoslovakiaDenmarkDominicaDominican RepublicEastern AfricaEastern AsiaEastern EuropeEcuadorEgyptEl SalvadorEnglandEritreaEthiopiaEuropeFijiFranceGermanyGhanaGreeceGrenadaGuatemalaGuyanaHaitiHondurasHong KongHungaryIndiaIndonesiaIranIraqIrelandIsraelItalyJamaicaJapanJordanKazakhstanKenyaKoreaKuwaitLaosLatin AmericaLatviaLebanonLiberiaLithuaniaMalaysiaMexicoMicronesiaMiddle AfricaMoldovaMoroccoNepalNetherlandsNicaraguaNigeriaNorth AmericaNorth MacedoniaNorthern AfricaNorthern EuropeNorwayOceaniaPakistanPanamaPeruPhilippinesPolandPortugalRomaniaRussiaSaudi ArabiaScotlandSenegalSerbiaSierra LeoneSingaporeSomaliaSouth AfricaSouth AmericaSouth Central AsiaSouth Eastern AsiaSouthern EuropeSpainSri LankaSt. Vincent and the GrenadinesSudanSwedenSwitzerlandSyriaTaiwanThailandTrinidad and TobagoTurkeyUgandaUkraineUruguayUzbekistanVenezuelaVietnamWest IndiesWestern AfricaWestern AsiaWestern EuropeYemenZaireZimbabweAzores
Married-Couple Family Poverty
Income
Poverty
Unemployment
Labor Participation
Family Structure
Vehicle Availability
Education Level
Disability

Icelander Married-Couple Family Poverty
Exceptional

4.5%
POVERTY | MARRIED-COUPLE FAMILIES
99.0/ 100
METRIC RATING
80th/ 347
METRIC RANK

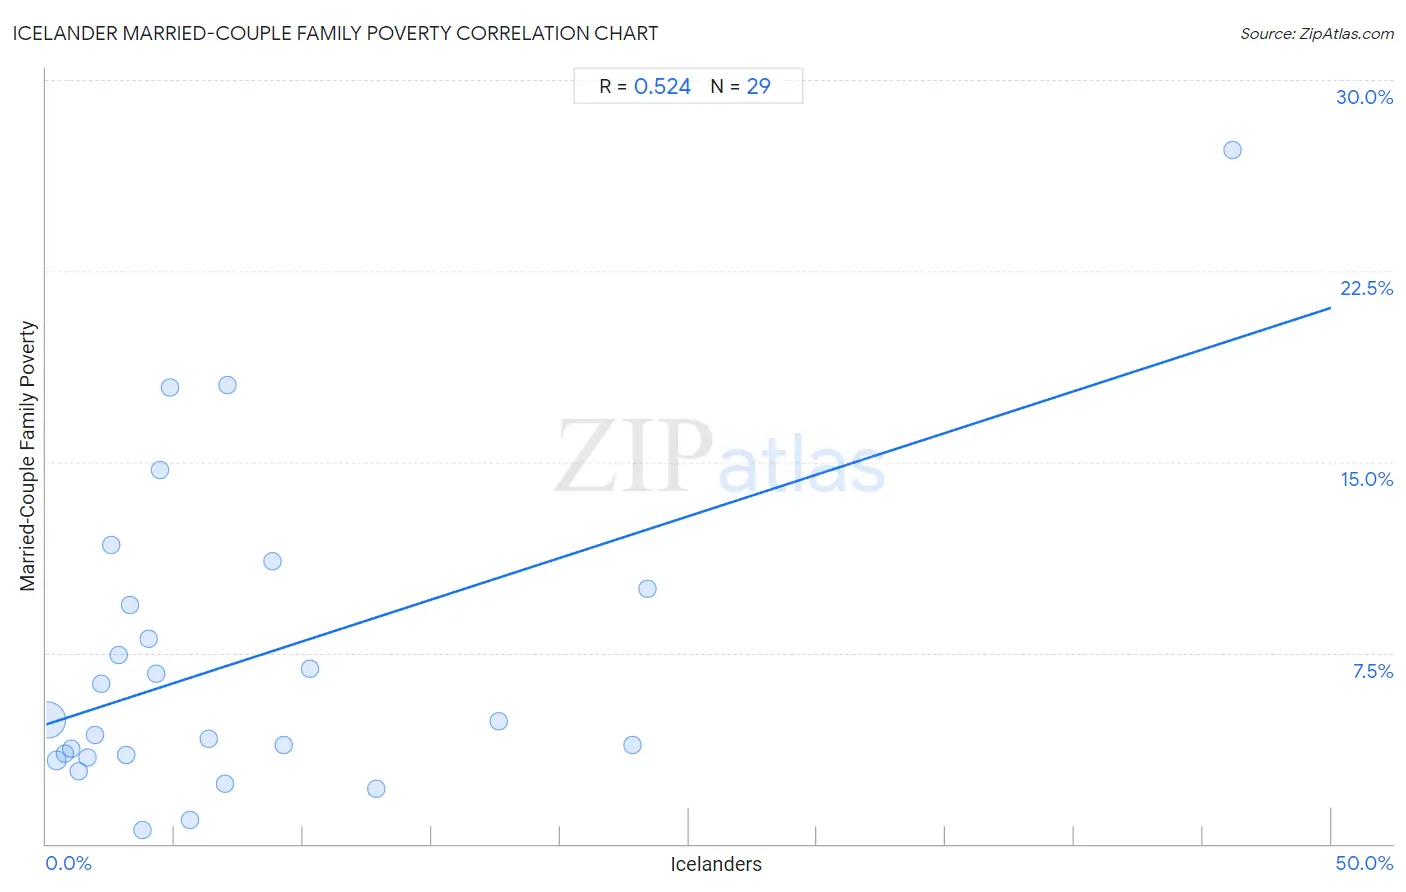
Icelander Married-Couple Family Poverty Correlation Chart

The statistical analysis conducted on geographies consisting of 159,057,565 people shows a substantial positive correlation between the proportion of Icelanders and poverty level among married-couple families in the United States with a correlation coefficient (R) of 0.524 and weighted average of 4.5%. On average, for every 1% (one percent) increase in Icelanders within a typical geography, there is an increase of 0.33% in poverty level among married-couple families.
Icelander Married-Couple Family Poverty
It is essential to understand that the correlation between the percentage of Icelanders and poverty level among married-couple families does not imply a direct cause-and-effect relationship. It remains uncertain whether the presence of Icelanders influences an upward or downward trend in the level of poverty level among married-couple families within an area, or if Icelanders simply ended up residing in those areas with higher or lower levels of poverty level among married-couple families due to other factors.

Demographics Similar to Icelanders by Married-Couple Family Poverty

In terms of married-couple family poverty, the demographic groups most similar to Icelanders are Immigrants from Iran (4.5%, a difference of 0.060%), Immigrants from Greece (4.5%, a difference of 0.14%), Scotch-Irish (4.5%, a difference of 0.29%), Immigrants from Latvia (4.5%, a difference of 0.38%), and Canadian (4.5%, a difference of 0.39%).
DemographicsRating | RankMarried-Couple Family Poverty
Ukrainians
99.2
/100
|
#73
Exceptional
4.5%
Immigrants from Austria
99.2
/100
|
#74
Exceptional
4.5%
Cambodians
99.2
/100
|
#75
Exceptional
4.5%
Immigrants from South Africa
99.1
/100
|
#76
Exceptional
4.5%
Immigrants from Latvia
99.1
/100
|
#77
Exceptional
4.5%
Scotch-Irish
99.1
/100
|
#78
Exceptional
4.5%
Immigrants from Iran
99.0
/100
|
#79
Exceptional
4.5%
Icelanders
99.0
/100
|
#80
Exceptional
4.5%
Immigrants from Greece
98.9
/100
|
#81
Exceptional
4.5%
Canadians
98.8
/100
|
#82
Exceptional
4.5%
Immigrants from Denmark
98.8
/100
|
#83
Exceptional
4.6%
Immigrants from Croatia
98.7
/100
|
#84
Exceptional
4.6%
South Africans
98.7
/100
|
#85
Exceptional
4.6%
Immigrants from Turkey
98.6
/100
|
#86
Exceptional
4.6%
Immigrants from North Macedonia
98.6
/100
|
#87
Exceptional
4.6%

Icelander Married-Couple Family Poverty Correlation Summary

MeasurementIcelander DataMarried-Couple Family Poverty Data
Minimum0.041%0.56%
Maximum46.2%27.3%
Range46.1%26.7%
Mean7.6%7.2%
Median4.3%4.8%
Interquartile 25% (IQ1)2.0%3.4%
Interquartile 75% (IQ3)9.0%9.7%
Interquartile Range (IQR)7.0%6.2%
Standard Deviation (Sample)9.6%6.0%
Standard Deviation (Population)9.5%5.9%

Correlation Details

Icelander PercentileSample SizeMarried-Couple Family Poverty
[
0.0%
-
0.5%
]
0.041%
154,732,3614.9%
[
0.0%
-
0.5%
]
0.41%
3,161,8923.3%
[
0.5%
-
1.0%
]
0.75%
625,4583.5%
[
0.5%
-
1.0%
]
1.00%
295,2103.8%
[
1.0%
-
1.5%
]
1.28%
87,7502.8%
[
1.5%
-
2.0%
]
1.59%
61,6213.4%
[
1.5%
-
2.0%
]
1.89%
26,8124.3%
[
2.0%
-
2.5%
]
2.13%
22,9016.3%
[
2.5%
-
3.0%
]
2.51%
7,69911.7%
[
2.5%
-
3.0%
]
2.84%
9,6677.4%
[
3.0%
-
3.5%
]
3.12%
5,0573.5%
[
3.0%
-
3.5%
]
3.26%
7989.4%
[
3.5%
-
4.0%
]
3.75%
8010.56%
[
4.0%
-
4.5%
]
4.01%
3,7668.0%
[
4.0%
-
4.5%
]
4.29%
4436.7%
[
4.0%
-
4.5%
]
4.45%
2,06914.7%
[
4.5%
-
5.0%
]
4.81%
54017.9%
[
5.5%
-
6.0%
]
5.60%
5,3610.92%
[
6.0%
-
6.5%
]
6.30%
1,2704.1%
[
6.5%
-
7.0%
]
6.95%
5612.4%
[
7.0%
-
7.5%
]
7.05%
22718.0%
[
8.5%
-
9.0%
]
8.81%
15911.1%
[
9.0%
-
9.5%
]
9.26%
1,3603.9%
[
10.0%
-
10.5%
]
10.27%
2,4436.9%
[
12.5%
-
13.0%
]
12.82%
1952.2%
[
17.5%
-
18.0%
]
17.61%
3524.8%
[
22.5%
-
23.0%
]
22.80%
5353.9%
[
23.0%
-
23.5%
]
23.39%
21810.0%
[
46.0%
-
46.5%
]
46.15%
3927.3%