Immigrants from Eastern Africa Married-Couple Family Poverty
COMPARE
Immigrants from Eastern Africa
Select to Compare
Married-Couple Family Poverty
Immigrants from Eastern Africa Married-Couple Family Poverty
5.2%
POVERTY | MARRIED-COUPLE FAMILIES
50.0/ 100
METRIC RATING
174th/ 347
METRIC RANK
Immigrants from Eastern Africa Married-Couple Family Poverty Correlation Chart
The statistical analysis conducted on geographies consisting of 352,572,169 people shows a very strong positive correlation between the proportion of Immigrants from Eastern Africa and poverty level among married-couple families in the United States with a correlation coefficient (R) of 0.825 and weighted average of 5.2%. On average, for every 1% (one percent) increase in Immigrants from Eastern Africa within a typical geography, there is an increase of 0.73% in poverty level among married-couple families.
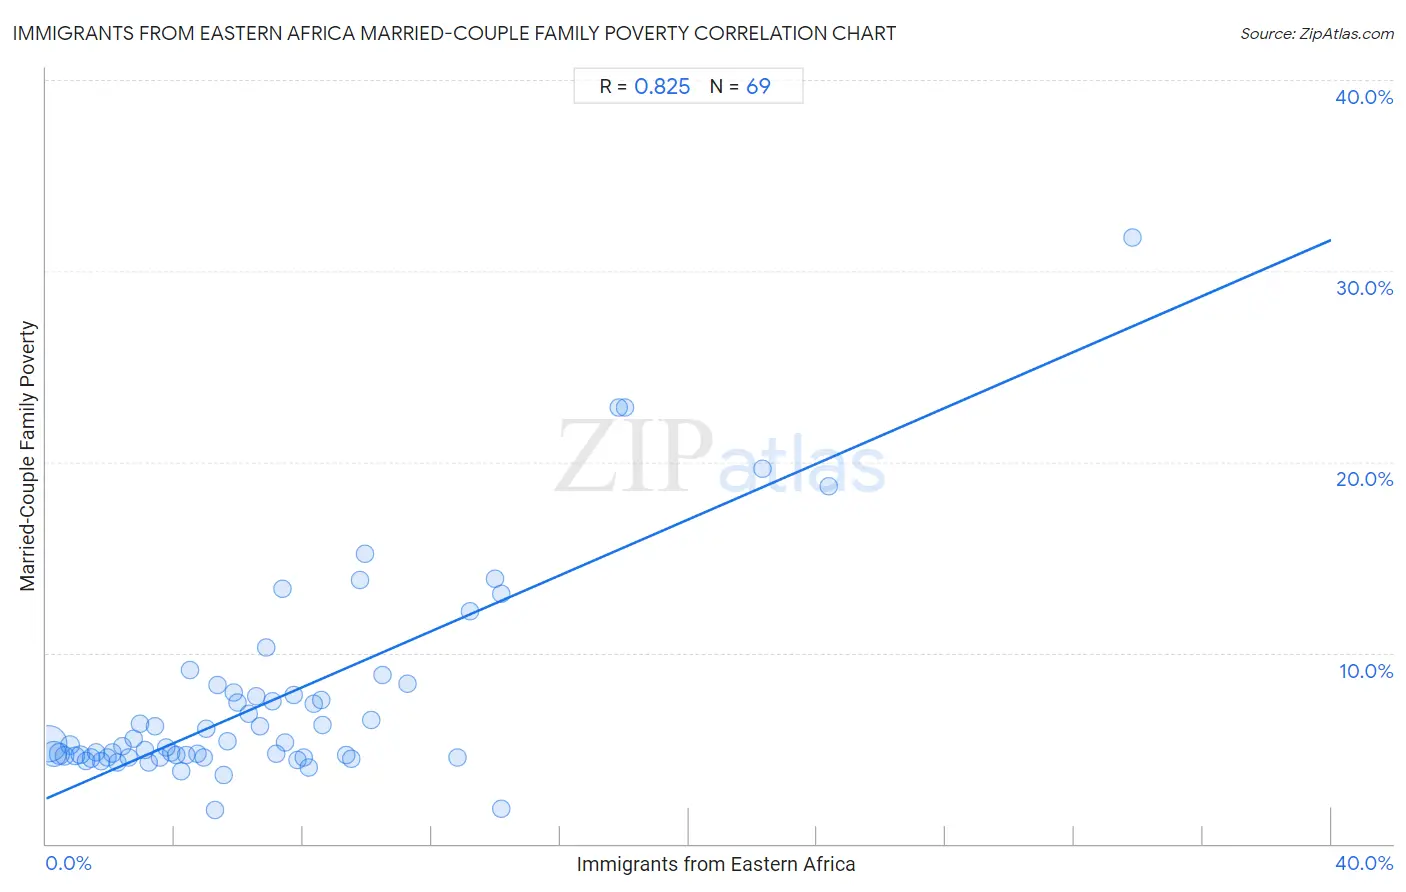
It is essential to understand that the correlation between the percentage of Immigrants from Eastern Africa and poverty level among married-couple families does not imply a direct cause-and-effect relationship. It remains uncertain whether the presence of Immigrants from Eastern Africa influences an upward or downward trend in the level of poverty level among married-couple families within an area, or if Immigrants from Eastern Africa simply ended up residing in those areas with higher or lower levels of poverty level among married-couple families due to other factors.
Demographics Similar to Immigrants from Eastern Africa by Married-Couple Family Poverty
In terms of married-couple family poverty, the demographic groups most similar to Immigrants from Eastern Africa are Alsatian (5.2%, a difference of 0.14%), Immigrants from Northern Africa (5.2%, a difference of 0.16%), Marshallese (5.2%, a difference of 0.24%), Menominee (5.2%, a difference of 0.25%), and Bermudan (5.2%, a difference of 0.33%).
| Demographics | Rating | Rank | Married-Couple Family Poverty |
| Costa Ricans | 61.5 /100 | #167 | Good 5.1% |
| Immigrants from Uganda | 54.9 /100 | #168 | Average 5.2% |
| Ottawa | 54.5 /100 | #169 | Average 5.2% |
| Immigrants from Argentina | 54.4 /100 | #170 | Average 5.2% |
| Bermudans | 52.9 /100 | #171 | Average 5.2% |
| Immigrants from Northern Africa | 51.3 /100 | #172 | Average 5.2% |
| Alsatians | 51.2 /100 | #173 | Average 5.2% |
| Immigrants from Eastern Africa | 50.0 /100 | #174 | Average 5.2% |
| Marshallese | 47.9 /100 | #175 | Average 5.2% |
| Menominee | 47.8 /100 | #176 | Average 5.2% |
| Immigrants from Kazakhstan | 45.1 /100 | #177 | Average 5.2% |
| Immigrants from Ukraine | 44.9 /100 | #178 | Average 5.2% |
| Spanish | 41.4 /100 | #179 | Average 5.3% |
| Immigrants from Sierra Leone | 39.3 /100 | #180 | Fair 5.3% |
| Immigrants from Chile | 38.8 /100 | #181 | Fair 5.3% |
Immigrants from Eastern Africa Married-Couple Family Poverty Correlation Summary
| Measurement | Immigrants from Eastern Africa Data | Married-Couple Family Poverty Data |
| Minimum | 0.073% | 1.7% |
| Maximum | 33.8% | 31.7% |
| Range | 33.7% | 30.0% |
| Mean | 7.0% | 7.5% |
| Median | 5.7% | 5.2% |
| Interquartile 25% (IQ1) | 2.8% | 4.5% |
| Interquartile 75% (IQ3) | 9.0% | 7.8% |
| Interquartile Range (IQR) | 6.2% | 3.3% |
| Standard Deviation (Sample) | 6.0% | 5.4% |
| Standard Deviation (Population) | 6.0% | 5.3% |
Correlation Details
| Immigrants from Eastern Africa Percentile | Sample Size | Married-Couple Family Poverty |
[ 0.0% - 0.5% ] 0.073% | 180,567,455 | 5.2% |
[ 0.0% - 0.5% ] 0.23% | 69,339,909 | 4.7% |
[ 0.0% - 0.5% ] 0.41% | 33,587,745 | 4.7% |
[ 0.5% - 1.0% ] 0.57% | 20,557,507 | 4.6% |
[ 0.5% - 1.0% ] 0.74% | 11,182,467 | 5.2% |
[ 0.5% - 1.0% ] 0.90% | 6,699,826 | 4.6% |
[ 1.0% - 1.5% ] 1.06% | 5,250,055 | 4.7% |
[ 1.0% - 1.5% ] 1.24% | 4,451,502 | 4.3% |
[ 1.0% - 1.5% ] 1.39% | 1,972,358 | 4.5% |
[ 1.5% - 2.0% ] 1.56% | 3,399,960 | 4.8% |
[ 1.5% - 2.0% ] 1.72% | 1,473,703 | 4.3% |
[ 1.5% - 2.0% ] 1.91% | 950,324 | 4.5% |
[ 2.0% - 2.5% ] 2.06% | 1,456,450 | 4.8% |
[ 2.0% - 2.5% ] 2.22% | 1,473,808 | 4.3% |
[ 2.0% - 2.5% ] 2.37% | 1,648,075 | 5.1% |
[ 2.5% - 3.0% ] 2.56% | 618,687 | 4.5% |
[ 2.5% - 3.0% ] 2.71% | 674,173 | 5.5% |
[ 2.5% - 3.0% ] 2.92% | 703,917 | 6.3% |
[ 3.0% - 3.5% ] 3.06% | 662,437 | 4.9% |
[ 3.0% - 3.5% ] 3.20% | 249,920 | 4.3% |
[ 3.0% - 3.5% ] 3.40% | 440,769 | 6.2% |
[ 3.5% - 4.0% ] 3.55% | 556,952 | 4.5% |
[ 3.5% - 4.0% ] 3.72% | 781,863 | 5.1% |
[ 3.5% - 4.0% ] 3.88% | 266,089 | 4.8% |
[ 4.0% - 4.5% ] 4.06% | 187,429 | 4.7% |
[ 4.0% - 4.5% ] 4.21% | 61,017 | 3.8% |
[ 4.0% - 4.5% ] 4.35% | 145,660 | 4.7% |
[ 4.0% - 4.5% ] 4.48% | 310,266 | 9.1% |
[ 4.5% - 5.0% ] 4.71% | 372,083 | 4.7% |
[ 4.5% - 5.0% ] 4.90% | 578,266 | 4.5% |
[ 4.5% - 5.0% ] 4.99% | 143,183 | 6.0% |
[ 5.0% - 5.5% ] 5.27% | 20,228 | 1.7% |
[ 5.0% - 5.5% ] 5.34% | 146,778 | 8.3% |
[ 5.5% - 6.0% ] 5.52% | 149,336 | 3.6% |
[ 5.5% - 6.0% ] 5.66% | 60,781 | 5.4% |
[ 5.5% - 6.0% ] 5.82% | 7,231 | 7.9% |
[ 5.5% - 6.0% ] 5.96% | 23,762 | 7.4% |
[ 6.0% - 6.5% ] 6.31% | 44,512 | 6.8% |
[ 6.5% - 7.0% ] 6.52% | 141,127 | 7.7% |
[ 6.5% - 7.0% ] 6.67% | 165,677 | 6.2% |
[ 6.5% - 7.0% ] 6.87% | 112,985 | 10.3% |
[ 7.0% - 7.5% ] 7.04% | 81,317 | 7.4% |
[ 7.0% - 7.5% ] 7.16% | 40,566 | 4.7% |
[ 7.0% - 7.5% ] 7.35% | 75,527 | 13.3% |
[ 7.0% - 7.5% ] 7.44% | 112,595 | 5.3% |
[ 7.5% - 8.0% ] 7.71% | 120,966 | 7.8% |
[ 7.5% - 8.0% ] 7.84% | 14,521 | 4.4% |
[ 8.0% - 8.5% ] 8.01% | 73,858 | 4.5% |
[ 8.0% - 8.5% ] 8.18% | 20,561 | 4.0% |
[ 8.0% - 8.5% ] 8.33% | 19,531 | 7.3% |
[ 8.5% - 9.0% ] 8.56% | 25,823 | 7.5% |
[ 8.5% - 9.0% ] 8.62% | 86,918 | 6.2% |
[ 9.0% - 9.5% ] 9.33% | 24,308 | 4.6% |
[ 9.0% - 9.5% ] 9.48% | 42,084 | 4.4% |
[ 9.5% - 10.0% ] 9.76% | 2,694 | 13.8% |
[ 9.5% - 10.0% ] 9.92% | 30,625 | 15.2% |
[ 10.0% - 10.5% ] 10.12% | 1,403 | 6.5% |
[ 10.0% - 10.5% ] 10.45% | 3,914 | 8.8% |
[ 11.0% - 11.5% ] 11.23% | 4,346 | 8.4% |
[ 12.5% - 13.0% ] 12.79% | 30,927 | 4.5% |
[ 13.0% - 13.5% ] 13.17% | 8,290 | 12.2% |
[ 13.5% - 14.0% ] 13.95% | 28,172 | 13.9% |
[ 14.0% - 14.5% ] 14.17% | 27,523 | 1.8% |
[ 14.0% - 14.5% ] 14.18% | 7,703 | 13.1% |
[ 17.5% - 18.0% ] 17.82% | 26,684 | 22.9% |
[ 18.0% - 18.5% ] 18.03% | 14,553 | 22.9% |
[ 22.0% - 22.5% ] 22.30% | 1,157 | 19.6% |
[ 24.0% - 24.5% ] 24.37% | 439 | 18.8% |
[ 33.5% - 34.0% ] 33.82% | 8,892 | 31.7% |