Immigrants from Western Africa Married-Couple Family Poverty
COMPARE
Immigrants from Western Africa
Select to Compare
Married-Couple Family Poverty
Immigrants from Western Africa Married-Couple Family Poverty
5.8%
POVERTY | MARRIED-COUPLE FAMILIES
2.4/ 100
METRIC RATING
242nd/ 347
METRIC RANK
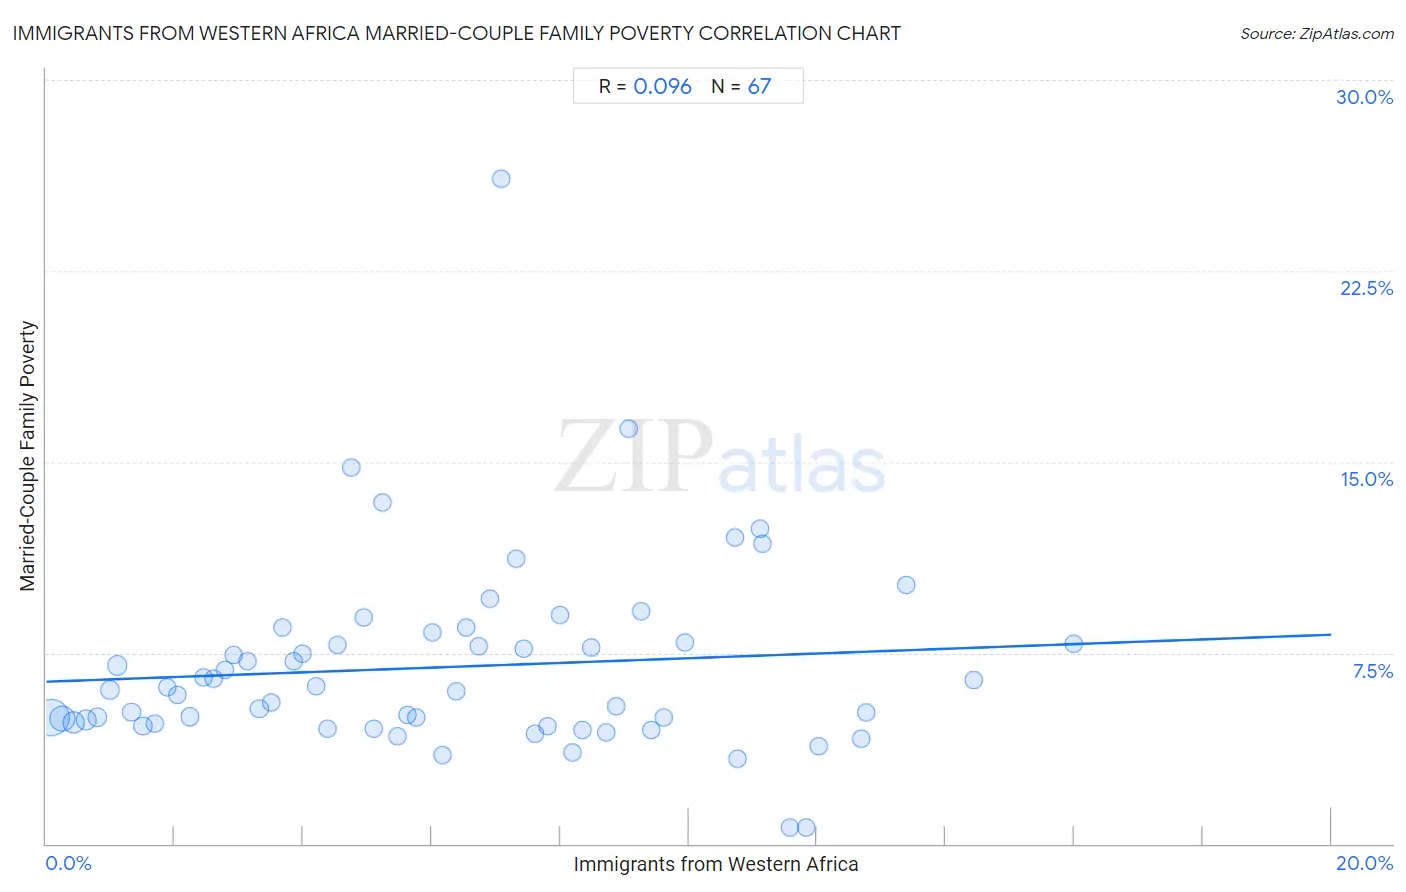
Immigrants from Western Africa Married-Couple Family Poverty Correlation Chart
The statistical analysis conducted on geographies consisting of 355,238,602 people shows a slight positive correlation between the proportion of Immigrants from Western Africa and poverty level among married-couple families in the United States with a correlation coefficient (R) of 0.096 and weighted average of 5.8%. On average, for every 1% (one percent) increase in Immigrants from Western Africa within a typical geography, there is an increase of 0.092% in poverty level among married-couple families.
It is essential to understand that the correlation between the percentage of Immigrants from Western Africa and poverty level among married-couple families does not imply a direct cause-and-effect relationship. It remains uncertain whether the presence of Immigrants from Western Africa influences an upward or downward trend in the level of poverty level among married-couple families within an area, or if Immigrants from Western Africa simply ended up residing in those areas with higher or lower levels of poverty level among married-couple families due to other factors.
Demographics Similar to Immigrants from Western Africa by Married-Couple Family Poverty
In terms of married-couple family poverty, the demographic groups most similar to Immigrants from Western Africa are Immigrants from Panama (5.8%, a difference of 0.090%), Fijian (5.8%, a difference of 0.11%), Somali (5.8%, a difference of 0.16%), Chickasaw (5.8%, a difference of 0.17%), and Venezuelan (5.8%, a difference of 0.28%).
| Demographics | Rating | Rank | Married-Couple Family Poverty |
| Immigrants from Sudan | 3.5 /100 | #235 | Tragic 5.7% |
| Ghanaians | 3.3 /100 | #236 | Tragic 5.7% |
| Immigrants from South America | 3.1 /100 | #237 | Tragic 5.7% |
| Cherokee | 2.7 /100 | #238 | Tragic 5.8% |
| Venezuelans | 2.7 /100 | #239 | Tragic 5.8% |
| Fijians | 2.5 /100 | #240 | Tragic 5.8% |
| Immigrants from Panama | 2.5 /100 | #241 | Tragic 5.8% |
| Immigrants from Western Africa | 2.4 /100 | #242 | Tragic 5.8% |
| Somalis | 2.3 /100 | #243 | Tragic 5.8% |
| Chickasaw | 2.3 /100 | #244 | Tragic 5.8% |
| Immigrants from Afghanistan | 2.1 /100 | #245 | Tragic 5.8% |
| Immigrants from Venezuela | 1.8 /100 | #246 | Tragic 5.8% |
| Iraqis | 1.4 /100 | #247 | Tragic 5.9% |
| Cree | 1.2 /100 | #248 | Tragic 5.9% |
| Tsimshian | 1.1 /100 | #249 | Tragic 5.9% |
Immigrants from Western Africa Married-Couple Family Poverty Correlation Summary
| Measurement | Immigrants from Western Africa Data | Married-Couple Family Poverty Data |
| Minimum | 0.083% | 0.65% |
| Maximum | 16.0% | 26.1% |
| Range | 15.9% | 25.5% |
| Mean | 6.3% | 6.9% |
| Median | 6.0% | 6.1% |
| Interquartile 25% (IQ1) | 2.9% | 4.7% |
| Interquartile 75% (IQ3) | 9.1% | 7.9% |
| Interquartile Range (IQR) | 6.1% | 3.2% |
| Standard Deviation (Sample) | 3.9% | 3.8% |
| Standard Deviation (Population) | 3.9% | 3.8% |
Correlation Details
| Immigrants from Western Africa Percentile | Sample Size | Married-Couple Family Poverty |
[ 0.0% - 0.5% ] 0.083% | 161,674,201 | 5.0% |
[ 0.0% - 0.5% ] 0.26% | 66,970,679 | 4.9% |
[ 0.0% - 0.5% ] 0.43% | 34,338,487 | 4.8% |
[ 0.5% - 1.0% ] 0.62% | 22,300,669 | 4.9% |
[ 0.5% - 1.0% ] 0.80% | 14,172,122 | 5.0% |
[ 0.5% - 1.0% ] 0.99% | 11,426,116 | 6.1% |
[ 1.0% - 1.5% ] 1.11% | 14,065,173 | 7.0% |
[ 1.0% - 1.5% ] 1.33% | 5,536,798 | 5.2% |
[ 1.5% - 2.0% ] 1.51% | 3,574,619 | 4.6% |
[ 1.5% - 2.0% ] 1.69% | 3,526,509 | 4.7% |
[ 1.5% - 2.0% ] 1.88% | 2,743,525 | 6.1% |
[ 2.0% - 2.5% ] 2.05% | 1,671,689 | 5.8% |
[ 2.0% - 2.5% ] 2.23% | 1,702,891 | 5.0% |
[ 2.0% - 2.5% ] 2.44% | 940,054 | 6.5% |
[ 2.5% - 3.0% ] 2.61% | 1,644,344 | 6.5% |
[ 2.5% - 3.0% ] 2.79% | 598,517 | 6.8% |
[ 2.5% - 3.0% ] 2.92% | 623,268 | 7.4% |
[ 3.0% - 3.5% ] 3.13% | 541,814 | 7.2% |
[ 3.0% - 3.5% ] 3.32% | 436,382 | 5.3% |
[ 3.0% - 3.5% ] 3.49% | 424,008 | 5.5% |
[ 3.5% - 4.0% ] 3.67% | 531,992 | 8.5% |
[ 3.5% - 4.0% ] 3.85% | 691,740 | 7.2% |
[ 3.5% - 4.0% ] 3.98% | 197,172 | 7.5% |
[ 4.0% - 4.5% ] 4.21% | 446,739 | 6.2% |
[ 4.0% - 4.5% ] 4.39% | 334,910 | 4.5% |
[ 4.5% - 5.0% ] 4.53% | 673,498 | 7.8% |
[ 4.5% - 5.0% ] 4.74% | 141,144 | 14.8% |
[ 4.5% - 5.0% ] 4.95% | 113,688 | 8.9% |
[ 5.0% - 5.5% ] 5.10% | 97,955 | 4.5% |
[ 5.0% - 5.5% ] 5.23% | 169,206 | 13.4% |
[ 5.0% - 5.5% ] 5.47% | 124,680 | 4.2% |
[ 5.5% - 6.0% ] 5.63% | 177,262 | 5.1% |
[ 5.5% - 6.0% ] 5.77% | 88,743 | 5.0% |
[ 6.0% - 6.5% ] 6.02% | 330,250 | 8.3% |
[ 6.0% - 6.5% ] 6.17% | 68,593 | 3.5% |
[ 6.0% - 6.5% ] 6.38% | 107,926 | 6.0% |
[ 6.5% - 7.0% ] 6.54% | 178,929 | 8.5% |
[ 6.5% - 7.0% ] 6.73% | 139,922 | 7.8% |
[ 6.5% - 7.0% ] 6.91% | 186,939 | 9.6% |
[ 7.0% - 7.5% ] 7.09% | 1,735 | 26.1% |
[ 7.0% - 7.5% ] 7.31% | 33,837 | 11.2% |
[ 7.0% - 7.5% ] 7.43% | 146,673 | 7.6% |
[ 7.5% - 8.0% ] 7.62% | 113,192 | 4.3% |
[ 7.5% - 8.0% ] 7.81% | 76,206 | 4.6% |
[ 7.5% - 8.0% ] 8.00% | 51,040 | 9.0% |
[ 8.0% - 8.5% ] 8.20% | 56,022 | 3.6% |
[ 8.0% - 8.5% ] 8.34% | 82,895 | 4.5% |
[ 8.0% - 8.5% ] 8.49% | 104,594 | 7.7% |
[ 8.5% - 9.0% ] 8.72% | 38,178 | 4.4% |
[ 8.5% - 9.0% ] 8.88% | 148,611 | 5.4% |
[ 9.0% - 9.5% ] 9.06% | 73,971 | 16.3% |
[ 9.0% - 9.5% ] 9.25% | 57,184 | 9.2% |
[ 9.0% - 9.5% ] 9.41% | 139,811 | 4.5% |
[ 9.5% - 10.0% ] 9.61% | 50,885 | 5.0% |
[ 9.5% - 10.0% ] 9.94% | 20,820 | 7.9% |
[ 10.5% - 11.0% ] 10.73% | 2,219 | 12.0% |
[ 10.5% - 11.0% ] 10.75% | 35,488 | 3.3% |
[ 11.0% - 11.5% ] 11.10% | 10,682 | 12.4% |
[ 11.0% - 11.5% ] 11.15% | 3,156 | 11.8% |
[ 11.5% - 12.0% ] 11.57% | 9,781 | 0.65% |
[ 11.5% - 12.0% ] 11.82% | 9,574 | 0.66% |
[ 12.0% - 12.5% ] 12.03% | 104,713 | 3.8% |
[ 12.5% - 13.0% ] 12.69% | 69,225 | 4.1% |
[ 12.5% - 13.0% ] 12.77% | 47,677 | 5.2% |
[ 13.0% - 13.5% ] 13.38% | 31,018 | 10.2% |
[ 14.0% - 14.5% ] 14.44% | 2,348 | 6.5% |
[ 15.5% - 16.0% ] 15.99% | 3,914 | 7.8% |