Immigrants from Sri Lanka Married-Couple Family Poverty
COMPARE
Immigrants from Sri Lanka
Select to Compare
Married-Couple Family Poverty
Immigrants from Sri Lanka Married-Couple Family Poverty
4.4%
POVERTY | MARRIED-COUPLE FAMILIES
99.6/ 100
METRIC RATING
63rd/ 347
METRIC RANK
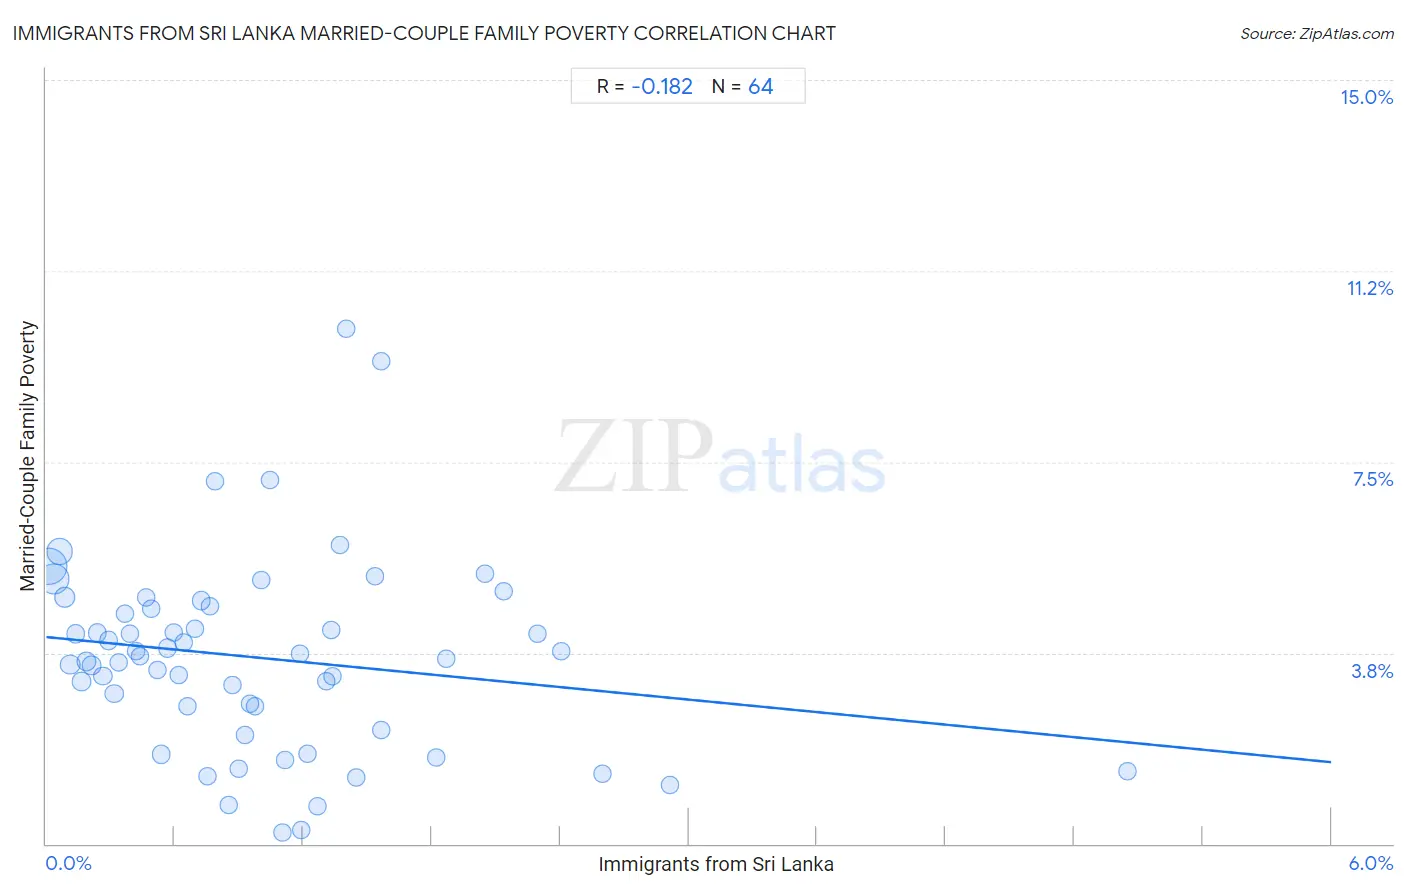
Immigrants from Sri Lanka Married-Couple Family Poverty Correlation Chart
The statistical analysis conducted on geographies consisting of 149,331,706 people shows a poor negative correlation between the proportion of Immigrants from Sri Lanka and poverty level among married-couple families in the United States with a correlation coefficient (R) of -0.182 and weighted average of 4.4%. On average, for every 1% (one percent) increase in Immigrants from Sri Lanka within a typical geography, there is a decrease of 0.41% in poverty level among married-couple families.
It is essential to understand that the correlation between the percentage of Immigrants from Sri Lanka and poverty level among married-couple families does not imply a direct cause-and-effect relationship. It remains uncertain whether the presence of Immigrants from Sri Lanka influences an upward or downward trend in the level of poverty level among married-couple families within an area, or if Immigrants from Sri Lanka simply ended up residing in those areas with higher or lower levels of poverty level among married-couple families due to other factors.
Demographics Similar to Immigrants from Sri Lanka by Married-Couple Family Poverty
In terms of married-couple family poverty, the demographic groups most similar to Immigrants from Sri Lanka are Immigrants from Australia (4.4%, a difference of 0.36%), Okinawan (4.4%, a difference of 0.37%), Immigrants from Bulgaria (4.4%, a difference of 0.41%), Tlingit-Haida (4.4%, a difference of 0.49%), and Immigrants from Sweden (4.4%, a difference of 0.56%).
| Demographics | Rating | Rank | Married-Couple Family Poverty |
| Immigrants from Zimbabwe | 99.7 /100 | #56 | Exceptional 4.3% |
| Immigrants from Netherlands | 99.7 /100 | #57 | Exceptional 4.3% |
| Czechoslovakians | 99.7 /100 | #58 | Exceptional 4.4% |
| Immigrants from Sweden | 99.6 /100 | #59 | Exceptional 4.4% |
| Tlingit-Haida | 99.6 /100 | #60 | Exceptional 4.4% |
| Okinawans | 99.6 /100 | #61 | Exceptional 4.4% |
| Immigrants from Australia | 99.6 /100 | #62 | Exceptional 4.4% |
| Immigrants from Sri Lanka | 99.6 /100 | #63 | Exceptional 4.4% |
| Immigrants from Bulgaria | 99.5 /100 | #64 | Exceptional 4.4% |
| Macedonians | 99.4 /100 | #65 | Exceptional 4.4% |
| Immigrants from Serbia | 99.4 /100 | #66 | Exceptional 4.4% |
| Immigrants from Canada | 99.4 /100 | #67 | Exceptional 4.4% |
| Slavs | 99.4 /100 | #68 | Exceptional 4.4% |
| New Zealanders | 99.4 /100 | #69 | Exceptional 4.4% |
| Immigrants from Korea | 99.4 /100 | #70 | Exceptional 4.5% |
Immigrants from Sri Lanka Married-Couple Family Poverty Correlation Summary
| Measurement | Immigrants from Sri Lanka Data | Married-Couple Family Poverty Data |
| Minimum | 0.013% | 0.22% |
| Maximum | 5.0% | 10.1% |
| Range | 5.0% | 9.9% |
| Mean | 0.99% | 3.7% |
| Median | 0.82% | 3.7% |
| Interquartile 25% (IQ1) | 0.40% | 2.5% |
| Interquartile 75% (IQ3) | 1.3% | 4.6% |
| Interquartile Range (IQR) | 0.93% | 2.2% |
| Standard Deviation (Sample) | 0.85% | 1.9% |
| Standard Deviation (Population) | 0.84% | 1.9% |
Correlation Details
| Immigrants from Sri Lanka Percentile | Sample Size | Married-Couple Family Poverty |
[ 0.0% - 0.5% ] 0.013% | 55,607,648 | 5.4% |
[ 0.0% - 0.5% ] 0.037% | 36,309,765 | 5.2% |
[ 0.0% - 0.5% ] 0.062% | 24,293,881 | 5.7% |
[ 0.0% - 0.5% ] 0.087% | 8,875,366 | 4.8% |
[ 0.0% - 0.5% ] 0.11% | 6,231,687 | 3.5% |
[ 0.0% - 0.5% ] 0.14% | 3,249,478 | 4.1% |
[ 0.0% - 0.5% ] 0.16% | 2,193,088 | 3.2% |
[ 0.0% - 0.5% ] 0.19% | 2,533,634 | 3.6% |
[ 0.0% - 0.5% ] 0.21% | 1,555,099 | 3.5% |
[ 0.0% - 0.5% ] 0.24% | 1,138,030 | 4.1% |
[ 0.0% - 0.5% ] 0.27% | 1,424,637 | 3.3% |
[ 0.0% - 0.5% ] 0.29% | 821,245 | 4.0% |
[ 0.0% - 0.5% ] 0.32% | 746,064 | 2.9% |
[ 0.0% - 0.5% ] 0.34% | 415,796 | 3.6% |
[ 0.0% - 0.5% ] 0.37% | 301,370 | 4.5% |
[ 0.0% - 0.5% ] 0.39% | 281,839 | 4.1% |
[ 0.0% - 0.5% ] 0.42% | 638,181 | 3.8% |
[ 0.0% - 0.5% ] 0.44% | 269,530 | 3.7% |
[ 0.0% - 0.5% ] 0.47% | 496,043 | 4.8% |
[ 0.0% - 0.5% ] 0.49% | 271,844 | 4.6% |
[ 0.5% - 1.0% ] 0.52% | 132,774 | 3.4% |
[ 0.5% - 1.0% ] 0.54% | 167,446 | 1.8% |
[ 0.5% - 1.0% ] 0.57% | 226,683 | 3.8% |
[ 0.5% - 1.0% ] 0.60% | 135,940 | 4.2% |
[ 0.5% - 1.0% ] 0.62% | 48,463 | 3.3% |
[ 0.5% - 1.0% ] 0.64% | 31,999 | 4.0% |
[ 0.5% - 1.0% ] 0.66% | 29,441 | 2.7% |
[ 0.5% - 1.0% ] 0.70% | 107,030 | 4.2% |
[ 0.5% - 1.0% ] 0.72% | 70,635 | 4.8% |
[ 0.5% - 1.0% ] 0.75% | 12,117 | 1.3% |
[ 0.5% - 1.0% ] 0.76% | 104,875 | 4.7% |
[ 0.5% - 1.0% ] 0.79% | 39,791 | 7.1% |
[ 0.5% - 1.0% ] 0.85% | 18,482 | 0.76% |
[ 0.5% - 1.0% ] 0.87% | 51,982 | 3.1% |
[ 0.5% - 1.0% ] 0.90% | 4,669 | 1.5% |
[ 0.5% - 1.0% ] 0.93% | 59,975 | 2.1% |
[ 0.5% - 1.0% ] 0.95% | 51,576 | 2.7% |
[ 0.5% - 1.0% ] 0.98% | 63,423 | 2.7% |
[ 1.0% - 1.5% ] 1.01% | 51,470 | 5.2% |
[ 1.0% - 1.5% ] 1.05% | 28,514 | 7.1% |
[ 1.0% - 1.5% ] 1.10% | 10,516 | 0.22% |
[ 1.0% - 1.5% ] 1.12% | 35,378 | 1.6% |
[ 1.0% - 1.5% ] 1.19% | 26,239 | 3.7% |
[ 1.0% - 1.5% ] 1.19% | 14,582 | 0.27% |
[ 1.0% - 1.5% ] 1.22% | 40,522 | 1.8% |
[ 1.0% - 1.5% ] 1.27% | 4,254 | 0.74% |
[ 1.0% - 1.5% ] 1.31% | 7,886 | 3.2% |
[ 1.0% - 1.5% ] 1.33% | 8,956 | 4.2% |
[ 1.0% - 1.5% ] 1.34% | 1,570 | 3.3% |
[ 1.0% - 1.5% ] 1.37% | 9,324 | 5.9% |
[ 1.0% - 1.5% ] 1.40% | 1,497 | 10.1% |
[ 1.0% - 1.5% ] 1.45% | 4,761 | 1.3% |
[ 1.5% - 2.0% ] 1.53% | 848 | 5.2% |
[ 1.5% - 2.0% ] 1.56% | 192 | 2.2% |
[ 1.5% - 2.0% ] 1.57% | 27,083 | 9.5% |
[ 1.5% - 2.0% ] 1.82% | 2,585 | 1.7% |
[ 1.5% - 2.0% ] 1.87% | 18,567 | 3.6% |
[ 2.0% - 2.5% ] 2.05% | 1,026 | 5.3% |
[ 2.0% - 2.5% ] 2.14% | 468 | 5.0% |
[ 2.0% - 2.5% ] 2.30% | 4,181 | 4.1% |
[ 2.0% - 2.5% ] 2.40% | 208 | 3.8% |
[ 2.5% - 3.0% ] 2.60% | 4,851 | 1.4% |
[ 2.5% - 3.0% ] 2.91% | 9,312 | 1.2% |
[ 5.0% - 5.5% ] 5.05% | 5,390 | 1.4% |