Afghan Married-Couple Family Poverty
COMPARE
Afghan
Select to Compare
Married-Couple Family Poverty
Afghan Married-Couple Family Poverty
5.5%
POVERTY | MARRIED-COUPLE FAMILIES
11.2/ 100
METRIC RATING
218th/ 347
METRIC RANK
Afghan Married-Couple Family Poverty Correlation Chart
The statistical analysis conducted on geographies consisting of 148,344,373 people shows a substantial positive correlation between the proportion of Afghans and poverty level among married-couple families in the United States with a correlation coefficient (R) of 0.527 and weighted average of 5.5%. On average, for every 1% (one percent) increase in Afghans within a typical geography, there is an increase of 1.3% in poverty level among married-couple families.
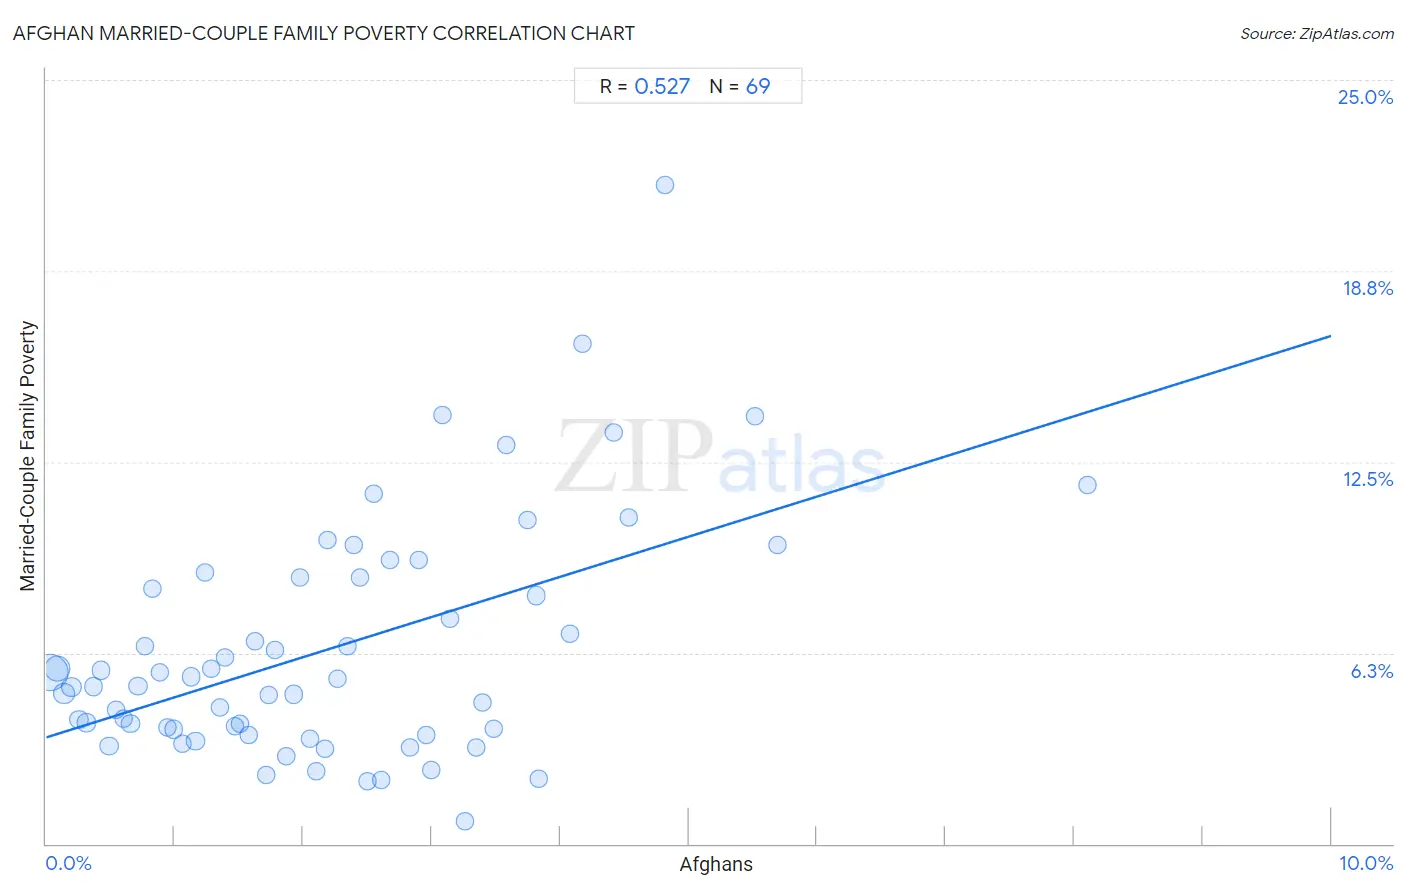
It is essential to understand that the correlation between the percentage of Afghans and poverty level among married-couple families does not imply a direct cause-and-effect relationship. It remains uncertain whether the presence of Afghans influences an upward or downward trend in the level of poverty level among married-couple families within an area, or if Afghans simply ended up residing in those areas with higher or lower levels of poverty level among married-couple families due to other factors.
Demographics Similar to Afghans by Married-Couple Family Poverty
In terms of married-couple family poverty, the demographic groups most similar to Afghans are Immigrants from Nigeria (5.5%, a difference of 0.020%), Potawatomi (5.5%, a difference of 0.31%), Japanese (5.6%, a difference of 0.40%), Armenian (5.5%, a difference of 0.43%), and Iroquois (5.5%, a difference of 0.49%).
| Demographics | Rating | Rank | Married-Couple Family Poverty |
| Nigerians | 14.3 /100 | #211 | Poor 5.5% |
| Immigrants from Thailand | 14.0 /100 | #212 | Poor 5.5% |
| Immigrants from Liberia | 13.3 /100 | #213 | Poor 5.5% |
| Iroquois | 13.1 /100 | #214 | Poor 5.5% |
| Armenians | 12.8 /100 | #215 | Poor 5.5% |
| Potawatomi | 12.4 /100 | #216 | Poor 5.5% |
| Immigrants from Nigeria | 11.3 /100 | #217 | Poor 5.5% |
| Afghans | 11.2 /100 | #218 | Poor 5.5% |
| Japanese | 9.8 /100 | #219 | Tragic 5.6% |
| Colombians | 9.2 /100 | #220 | Tragic 5.6% |
| Panamanians | 9.2 /100 | #221 | Tragic 5.6% |
| Cajuns | 6.9 /100 | #222 | Tragic 5.6% |
| Immigrants from Fiji | 6.7 /100 | #223 | Tragic 5.6% |
| Sudanese | 6.4 /100 | #224 | Tragic 5.6% |
| Immigrants from Cambodia | 6.1 /100 | #225 | Tragic 5.6% |
Afghan Married-Couple Family Poverty Correlation Summary
| Measurement | Afghan Data | Married-Couple Family Poverty Data |
| Minimum | 0.028% | 0.76% |
| Maximum | 8.1% | 21.6% |
| Range | 8.1% | 20.8% |
| Mean | 2.2% | 6.4% |
| Median | 2.0% | 5.2% |
| Interquartile 25% (IQ1) | 0.97% | 3.7% |
| Interquartile 75% (IQ3) | 3.1% | 8.7% |
| Interquartile Range (IQR) | 2.1% | 5.1% |
| Standard Deviation (Sample) | 1.6% | 3.9% |
| Standard Deviation (Population) | 1.5% | 3.9% |
Correlation Details
| Afghan Percentile | Sample Size | Married-Couple Family Poverty |
[ 0.0% - 0.5% ] 0.028% | 72,258,996 | 5.6% |
[ 0.0% - 0.5% ] 0.085% | 30,211,019 | 5.7% |
[ 0.0% - 0.5% ] 0.14% | 11,197,142 | 4.9% |
[ 0.0% - 0.5% ] 0.20% | 8,306,108 | 5.1% |
[ 0.0% - 0.5% ] 0.26% | 3,473,321 | 4.1% |
[ 0.0% - 0.5% ] 0.31% | 3,163,101 | 4.0% |
[ 0.0% - 0.5% ] 0.37% | 2,166,358 | 5.1% |
[ 0.0% - 0.5% ] 0.43% | 2,047,459 | 5.7% |
[ 0.0% - 0.5% ] 0.49% | 1,763,171 | 3.2% |
[ 0.5% - 1.0% ] 0.54% | 1,420,536 | 4.4% |
[ 0.5% - 1.0% ] 0.60% | 1,012,840 | 4.1% |
[ 0.5% - 1.0% ] 0.66% | 896,747 | 3.9% |
[ 0.5% - 1.0% ] 0.71% | 1,044,547 | 5.2% |
[ 0.5% - 1.0% ] 0.77% | 685,176 | 6.5% |
[ 0.5% - 1.0% ] 0.82% | 693,720 | 8.3% |
[ 0.5% - 1.0% ] 0.88% | 1,059,792 | 5.6% |
[ 0.5% - 1.0% ] 0.95% | 512,252 | 3.8% |
[ 0.5% - 1.0% ] 0.99% | 541,104 | 3.7% |
[ 1.0% - 1.5% ] 1.06% | 534,885 | 3.3% |
[ 1.0% - 1.5% ] 1.13% | 512,179 | 5.5% |
[ 1.0% - 1.5% ] 1.16% | 774,738 | 3.4% |
[ 1.0% - 1.5% ] 1.24% | 206,080 | 8.9% |
[ 1.0% - 1.5% ] 1.28% | 282,916 | 5.7% |
[ 1.0% - 1.5% ] 1.35% | 302,361 | 4.5% |
[ 1.0% - 1.5% ] 1.39% | 234,484 | 6.1% |
[ 1.0% - 1.5% ] 1.47% | 226,491 | 3.9% |
[ 1.5% - 2.0% ] 1.51% | 130,519 | 3.9% |
[ 1.5% - 2.0% ] 1.58% | 63,675 | 3.6% |
[ 1.5% - 2.0% ] 1.63% | 193,212 | 6.6% |
[ 1.5% - 2.0% ] 1.71% | 220,784 | 2.3% |
[ 1.5% - 2.0% ] 1.73% | 118,452 | 4.9% |
[ 1.5% - 2.0% ] 1.78% | 105,622 | 6.4% |
[ 1.5% - 2.0% ] 1.87% | 86,445 | 2.9% |
[ 1.5% - 2.0% ] 1.92% | 128,760 | 4.9% |
[ 1.5% - 2.0% ] 1.97% | 197,702 | 8.7% |
[ 2.0% - 2.5% ] 2.05% | 163,413 | 3.5% |
[ 2.0% - 2.5% ] 2.10% | 40,892 | 2.4% |
[ 2.0% - 2.5% ] 2.17% | 94,027 | 3.1% |
[ 2.0% - 2.5% ] 2.19% | 99,912 | 10.0% |
[ 2.0% - 2.5% ] 2.26% | 192,523 | 5.4% |
[ 2.0% - 2.5% ] 2.34% | 49,711 | 6.5% |
[ 2.0% - 2.5% ] 2.39% | 65,305 | 9.8% |
[ 2.0% - 2.5% ] 2.44% | 78,508 | 8.7% |
[ 2.5% - 3.0% ] 2.50% | 17,926 | 2.0% |
[ 2.5% - 3.0% ] 2.55% | 28,088 | 11.4% |
[ 2.5% - 3.0% ] 2.61% | 35,162 | 2.1% |
[ 2.5% - 3.0% ] 2.68% | 1,607 | 9.3% |
[ 2.5% - 3.0% ] 2.83% | 149,299 | 3.1% |
[ 2.5% - 3.0% ] 2.90% | 24,438 | 9.3% |
[ 2.5% - 3.0% ] 2.96% | 10,976 | 3.6% |
[ 2.5% - 3.0% ] 3.00% | 767 | 2.4% |
[ 3.0% - 3.5% ] 3.08% | 23,756 | 14.0% |
[ 3.0% - 3.5% ] 3.14% | 19,531 | 7.3% |
[ 3.0% - 3.5% ] 3.26% | 3,404 | 0.76% |
[ 3.0% - 3.5% ] 3.34% | 35,001 | 3.1% |
[ 3.0% - 3.5% ] 3.40% | 6,884 | 4.6% |
[ 3.0% - 3.5% ] 3.48% | 10,400 | 3.8% |
[ 3.5% - 4.0% ] 3.58% | 29,132 | 13.0% |
[ 3.5% - 4.0% ] 3.75% | 60,625 | 10.6% |
[ 3.5% - 4.0% ] 3.81% | 76,761 | 8.1% |
[ 3.5% - 4.0% ] 3.83% | 3,262 | 2.1% |
[ 4.0% - 4.5% ] 4.08% | 1,936 | 6.9% |
[ 4.0% - 4.5% ] 4.17% | 24,785 | 16.4% |
[ 4.0% - 4.5% ] 4.42% | 34,082 | 13.5% |
[ 4.5% - 5.0% ] 4.53% | 2,694 | 10.7% |
[ 4.5% - 5.0% ] 4.82% | 16,050 | 21.6% |
[ 5.5% - 6.0% ] 5.51% | 37,310 | 14.0% |
[ 5.5% - 6.0% ] 5.69% | 96,076 | 9.8% |
[ 8.0% - 8.5% ] 8.10% | 37,436 | 11.7% |