Chickasaw vs Immigrants from Northern Africa Married-Couple Family Poverty
COMPARE
Chickasaw
Immigrants from Northern Africa
Married-Couple Family Poverty
Married-Couple Family Poverty Comparison
Chickasaw
Immigrants from Northern Africa
5.8%
MARRIED-COUPLE FAMILY POVERTY
2.3/ 100
METRIC RATING
244th/ 347
METRIC RANK
5.2%
MARRIED-COUPLE FAMILY POVERTY
51.3/ 100
METRIC RATING
172nd/ 347
METRIC RANK
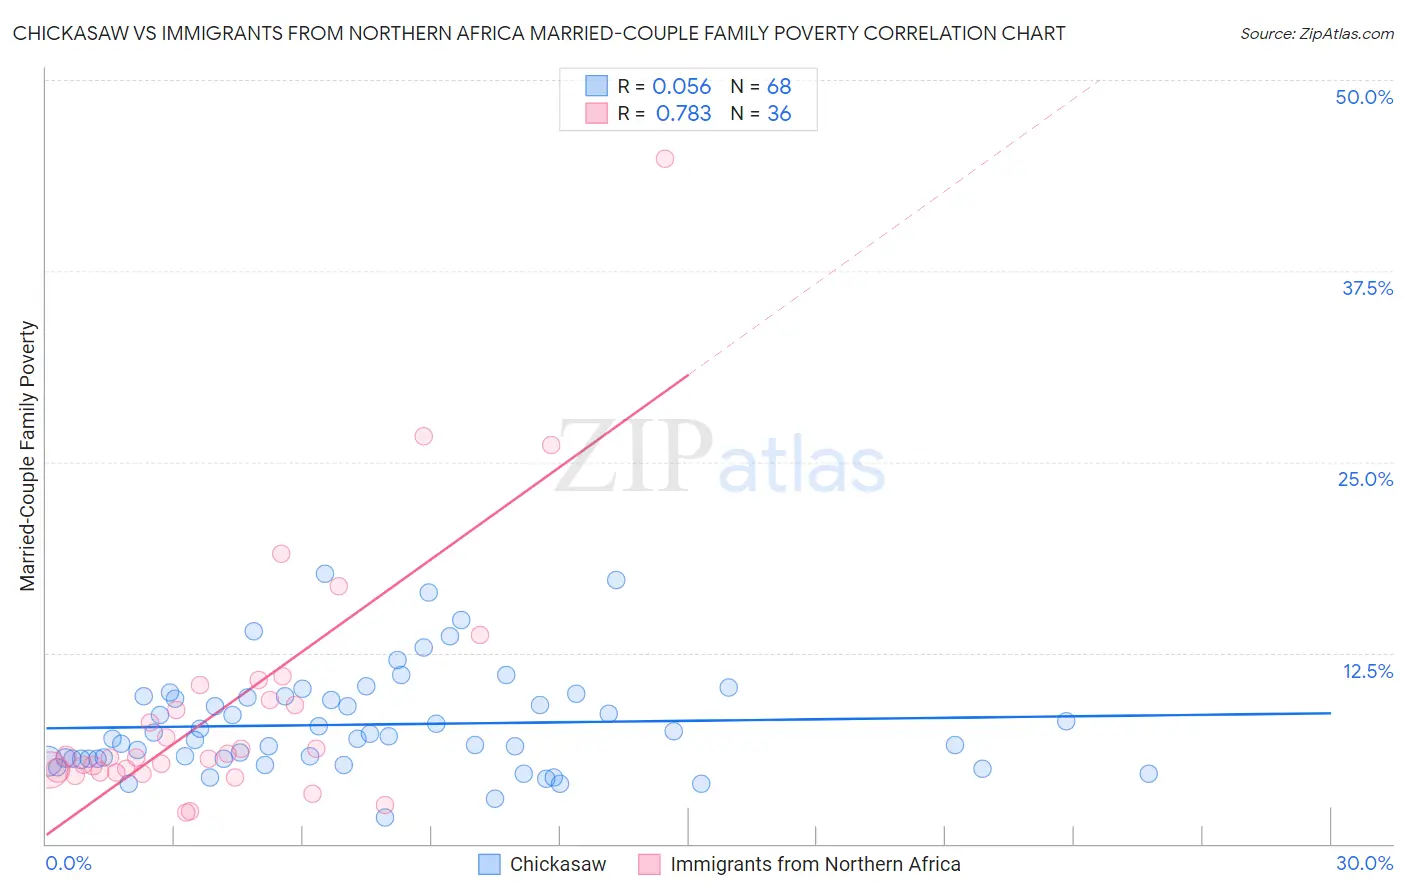
Chickasaw vs Immigrants from Northern Africa Married-Couple Family Poverty Correlation Chart
The statistical analysis conducted on geographies consisting of 147,342,221 people shows a slight positive correlation between the proportion of Chickasaw and poverty level among married-couple families in the United States with a correlation coefficient (R) of 0.056 and weighted average of 5.8%. Similarly, the statistical analysis conducted on geographies consisting of 319,156,358 people shows a strong positive correlation between the proportion of Immigrants from Northern Africa and poverty level among married-couple families in the United States with a correlation coefficient (R) of 0.783 and weighted average of 5.2%, a difference of 11.1%.
Married-Couple Family Poverty Correlation Summary
| Measurement | Chickasaw | Immigrants from Northern Africa |
| Minimum | 1.7% | 2.0% |
| Maximum | 17.6% | 44.8% |
| Range | 16.0% | 42.8% |
| Mean | 7.8% | 9.0% |
| Median | 7.0% | 5.7% |
| Interquartile 25% (IQ1) | 5.5% | 4.8% |
| Interquartile 75% (IQ3) | 9.6% | 9.9% |
| Interquartile Range (IQR) | 4.1% | 5.2% |
| Standard Deviation (Sample) | 3.4% | 8.5% |
| Standard Deviation (Population) | 3.3% | 8.4% |
Similar Demographics by Married-Couple Family Poverty
Demographics Similar to Chickasaw by Married-Couple Family Poverty
In terms of married-couple family poverty, the demographic groups most similar to Chickasaw are Somali (5.8%, a difference of 0.010%), Immigrants from Afghanistan (5.8%, a difference of 0.15%), Immigrants from Western Africa (5.8%, a difference of 0.17%), Immigrants from Panama (5.8%, a difference of 0.26%), and Fijian (5.8%, a difference of 0.28%).
| Demographics | Rating | Rank | Married-Couple Family Poverty |
| Immigrants | South America | 3.1 /100 | #237 | Tragic 5.7% |
| Cherokee | 2.7 /100 | #238 | Tragic 5.8% |
| Venezuelans | 2.7 /100 | #239 | Tragic 5.8% |
| Fijians | 2.5 /100 | #240 | Tragic 5.8% |
| Immigrants | Panama | 2.5 /100 | #241 | Tragic 5.8% |
| Immigrants | Western Africa | 2.4 /100 | #242 | Tragic 5.8% |
| Somalis | 2.3 /100 | #243 | Tragic 5.8% |
| Chickasaw | 2.3 /100 | #244 | Tragic 5.8% |
| Immigrants | Afghanistan | 2.1 /100 | #245 | Tragic 5.8% |
| Immigrants | Venezuela | 1.8 /100 | #246 | Tragic 5.8% |
| Iraqis | 1.4 /100 | #247 | Tragic 5.9% |
| Cree | 1.2 /100 | #248 | Tragic 5.9% |
| Tsimshian | 1.1 /100 | #249 | Tragic 5.9% |
| Immigrants | Eritrea | 1.1 /100 | #250 | Tragic 5.9% |
| Immigrants | Ghana | 1.0 /100 | #251 | Tragic 5.9% |
Demographics Similar to Immigrants from Northern Africa by Married-Couple Family Poverty
In terms of married-couple family poverty, the demographic groups most similar to Immigrants from Northern Africa are Alsatian (5.2%, a difference of 0.020%), Immigrants from Eastern Africa (5.2%, a difference of 0.16%), Bermudan (5.2%, a difference of 0.18%), Immigrants from Argentina (5.2%, a difference of 0.35%), and Ottawa (5.2%, a difference of 0.37%).
| Demographics | Rating | Rank | Married-Couple Family Poverty |
| Immigrants | Malaysia | 62.2 /100 | #165 | Good 5.1% |
| Paraguayans | 61.5 /100 | #166 | Good 5.1% |
| Costa Ricans | 61.5 /100 | #167 | Good 5.1% |
| Immigrants | Uganda | 54.9 /100 | #168 | Average 5.2% |
| Ottawa | 54.5 /100 | #169 | Average 5.2% |
| Immigrants | Argentina | 54.4 /100 | #170 | Average 5.2% |
| Bermudans | 52.9 /100 | #171 | Average 5.2% |
| Immigrants | Northern Africa | 51.3 /100 | #172 | Average 5.2% |
| Alsatians | 51.2 /100 | #173 | Average 5.2% |
| Immigrants | Eastern Africa | 50.0 /100 | #174 | Average 5.2% |
| Marshallese | 47.9 /100 | #175 | Average 5.2% |
| Menominee | 47.8 /100 | #176 | Average 5.2% |
| Immigrants | Kazakhstan | 45.1 /100 | #177 | Average 5.2% |
| Immigrants | Ukraine | 44.9 /100 | #178 | Average 5.2% |
| Spanish | 41.4 /100 | #179 | Average 5.3% |