Immigrants from Panama Married-Couple Family Poverty

COMPARE

Immigrants from Panama
Race
Ancestry
AfghanAfricanAlaska NativeAlaskan AthabascanAlbanianAleutAlsatianAmericanApacheArabArapahoArgentineanArmenianAssyrian/Chaldean/SyriacAustralianAustrianBahamianBangladeshiBarbadianBasqueBelgianBelizeanBermudanBhutaneseBlackfeetBolivianBrazilianBritishBritish West IndianBulgarianBurmeseCajunCambodianCanadianCape VerdeanCarpatho RusynCelticCentral AmericanCentral American IndianCherokeeCheyenneChickasawChileanChineseChippewaChoctawColombianColvilleComancheCosta RicanCreeCreekCroatianCrowCubanCypriotCzechCzechoslovakianDanishDelawareDominicanDutchDutch West IndianEastern EuropeanEcuadorianEgyptianEnglishEstonianEthiopianEuropeanFijianFilipinoFinnishFrenchFrench American IndianFrench CanadianGermanGerman RussianGhanaianGreekGuamanian/ChamorroGuatemalanGuyaneseHaitianHmongHonduranHopiHoumaHungarianIcelanderIndian (Asian)IndonesianInupiatIranianIraqiIrishIroquoisIsraeliItalianJamaicanJapaneseJordanianKenyanKiowaKoreanLaotianLatvianLebaneseLiberianLithuanianLumbeeLuxembourgerMacedonianMalaysianMalteseMarshalleseMenomineeMexicanMexican American IndianMongolianMoroccanNative HawaiianNavajoNepaleseNew ZealanderNicaraguanNigerianNorthern EuropeanNorwegianOkinawanOsageOttawaPaiutePakistaniPalestinianPanamanianParaguayanPennsylvania GermanPeruvianPimaPolishPortuguesePotawatomiPuebloPuerto RicanPuget Sound SalishRomanianRussianSalvadoranSamoanScandinavianScotch-IrishScottishSeminoleSenegaleseSerbianShoshoneSierra LeoneanSiouxSlavicSlovakSloveneSomaliSouth AfricanSouth AmericanSouth American IndianSoviet UnionSpaniardSpanishSpanish AmericanSpanish American IndianSri LankanSubsaharan AfricanSudaneseSwedishSwissSyrianTaiwaneseThaiTlingit-HaidaTohono O'OdhamTonganTrinidadian and TobagonianTsimshianTurkishU.S. Virgin IslanderUgandanUkrainianUruguayanUteVenezuelanVietnameseWelshWest IndianYakamaYaquiYugoslavianYumanYup'ikZimbabwean
Immigration
NonimmigrantsImmigrantsAfghanistanAfricaAlbaniaArgentinaArmeniaAsiaAustraliaAustriaBahamasBangladeshBarbadosBelarusBelgiumBelizeBoliviaBosnia and HerzegovinaBrazilBulgariaBurma/MyanmarCabo VerdeCambodiaCameroonCanadaCaribbeanCentral AmericaChileChinaColombiaCongoCosta RicaCroatiaCubaCzechoslovakiaDenmarkDominicaDominican RepublicEastern AfricaEastern AsiaEastern EuropeEcuadorEgyptEl SalvadorEnglandEritreaEthiopiaEuropeFijiFranceGermanyGhanaGreeceGrenadaGuatemalaGuyanaHaitiHondurasHong KongHungaryIndiaIndonesiaIranIraqIrelandIsraelItalyJamaicaJapanJordanKazakhstanKenyaKoreaKuwaitLaosLatin AmericaLatviaLebanonLiberiaLithuaniaMalaysiaMexicoMicronesiaMiddle AfricaMoldovaMoroccoNepalNetherlandsNicaraguaNigeriaNorth AmericaNorth MacedoniaNorthern AfricaNorthern EuropeNorwayOceaniaPakistanPanamaPeruPhilippinesPolandPortugalRomaniaRussiaSaudi ArabiaScotlandSenegalSerbiaSierra LeoneSingaporeSomaliaSouth AfricaSouth AmericaSouth Central AsiaSouth Eastern AsiaSouthern EuropeSpainSri LankaSt. Vincent and the GrenadinesSudanSwedenSwitzerlandSyriaTaiwanThailandTrinidad and TobagoTurkeyUgandaUkraineUruguayUzbekistanVenezuelaVietnamWest IndiesWestern AfricaWestern AsiaWestern EuropeYemenZaireZimbabweAzores
Select to Compare
Race
Ancestry
AfghanAfricanAlaska NativeAlaskan AthabascanAlbanianAleutAlsatianAmericanApacheArabArapahoArgentineanArmenianAssyrian/Chaldean/SyriacAustralianAustrianBahamianBangladeshiBarbadianBasqueBelgianBelizeanBermudanBhutaneseBlackfeetBolivianBrazilianBritishBritish West IndianBulgarianBurmeseCajunCambodianCanadianCape VerdeanCarpatho RusynCelticCentral AmericanCentral American IndianCherokeeCheyenneChickasawChileanChineseChippewaChoctawColombianColvilleComancheCosta RicanCreeCreekCroatianCrowCubanCypriotCzechCzechoslovakianDanishDelawareDominicanDutchDutch West IndianEastern EuropeanEcuadorianEgyptianEnglishEstonianEthiopianEuropeanFijianFilipinoFinnishFrenchFrench American IndianFrench CanadianGermanGerman RussianGhanaianGreekGuamanian/ChamorroGuatemalanGuyaneseHaitianHmongHonduranHopiHoumaHungarianIcelanderIndian (Asian)IndonesianInupiatIranianIraqiIrishIroquoisIsraeliItalianJamaicanJapaneseJordanianKenyanKiowaKoreanLaotianLatvianLebaneseLiberianLithuanianLumbeeLuxembourgerMacedonianMalaysianMalteseMarshalleseMenomineeMexicanMexican American IndianMongolianMoroccanNative HawaiianNavajoNepaleseNew ZealanderNicaraguanNigerianNorthern EuropeanNorwegianOkinawanOsageOttawaPaiutePakistaniPalestinianPanamanianParaguayanPennsylvania GermanPeruvianPimaPolishPortuguesePotawatomiPuebloPuerto RicanPuget Sound SalishRomanianRussianSalvadoranSamoanScandinavianScotch-IrishScottishSeminoleSenegaleseSerbianShoshoneSierra LeoneanSiouxSlavicSlovakSloveneSomaliSouth AfricanSouth AmericanSouth American IndianSoviet UnionSpaniardSpanishSpanish AmericanSpanish American IndianSri LankanSubsaharan AfricanSudaneseSwedishSwissSyrianTaiwaneseThaiTlingit-HaidaTohono O'OdhamTonganTrinidadian and TobagonianTsimshianTurkishU.S. Virgin IslanderUgandanUkrainianUruguayanUteVenezuelanVietnameseWelshWest IndianYakamaYaquiYugoslavianYumanYup'ikZimbabwean
Immigration
NonimmigrantsImmigrantsAfghanistanAfricaAlbaniaArgentinaArmeniaAsiaAustraliaAustriaBahamasBangladeshBarbadosBelarusBelgiumBelizeBoliviaBosnia and HerzegovinaBrazilBulgariaBurma/MyanmarCabo VerdeCambodiaCameroonCanadaCaribbeanCentral AmericaChileChinaColombiaCongoCosta RicaCroatiaCubaCzechoslovakiaDenmarkDominicaDominican RepublicEastern AfricaEastern AsiaEastern EuropeEcuadorEgyptEl SalvadorEnglandEritreaEthiopiaEuropeFijiFranceGermanyGhanaGreeceGrenadaGuatemalaGuyanaHaitiHondurasHong KongHungaryIndiaIndonesiaIranIraqIrelandIsraelItalyJamaicaJapanJordanKazakhstanKenyaKoreaKuwaitLaosLatin AmericaLatviaLebanonLiberiaLithuaniaMalaysiaMexicoMicronesiaMiddle AfricaMoldovaMoroccoNepalNetherlandsNicaraguaNigeriaNorth AmericaNorth MacedoniaNorthern AfricaNorthern EuropeNorwayOceaniaPakistanPeruPhilippinesPolandPortugalRomaniaRussiaSaudi ArabiaScotlandSenegalSerbiaSierra LeoneSingaporeSomaliaSouth AfricaSouth AmericaSouth Central AsiaSouth Eastern AsiaSouthern EuropeSpainSri LankaSt. Vincent and the GrenadinesSudanSwedenSwitzerlandSyriaTaiwanThailandTrinidad and TobagoTurkeyUgandaUkraineUruguayUzbekistanVenezuelaVietnamWest IndiesWestern AfricaWestern AsiaWestern EuropeYemenZaireZimbabweAzores
Married-Couple Family Poverty
Income
Poverty
Unemployment
Labor Participation
Family Structure
Vehicle Availability
Education Level
Disability

Immigrants from Panama Married-Couple Family Poverty
Tragic

5.8%
POVERTY | MARRIED-COUPLE FAMILIES
2.5/ 100
METRIC RATING
241st/ 347
METRIC RANK

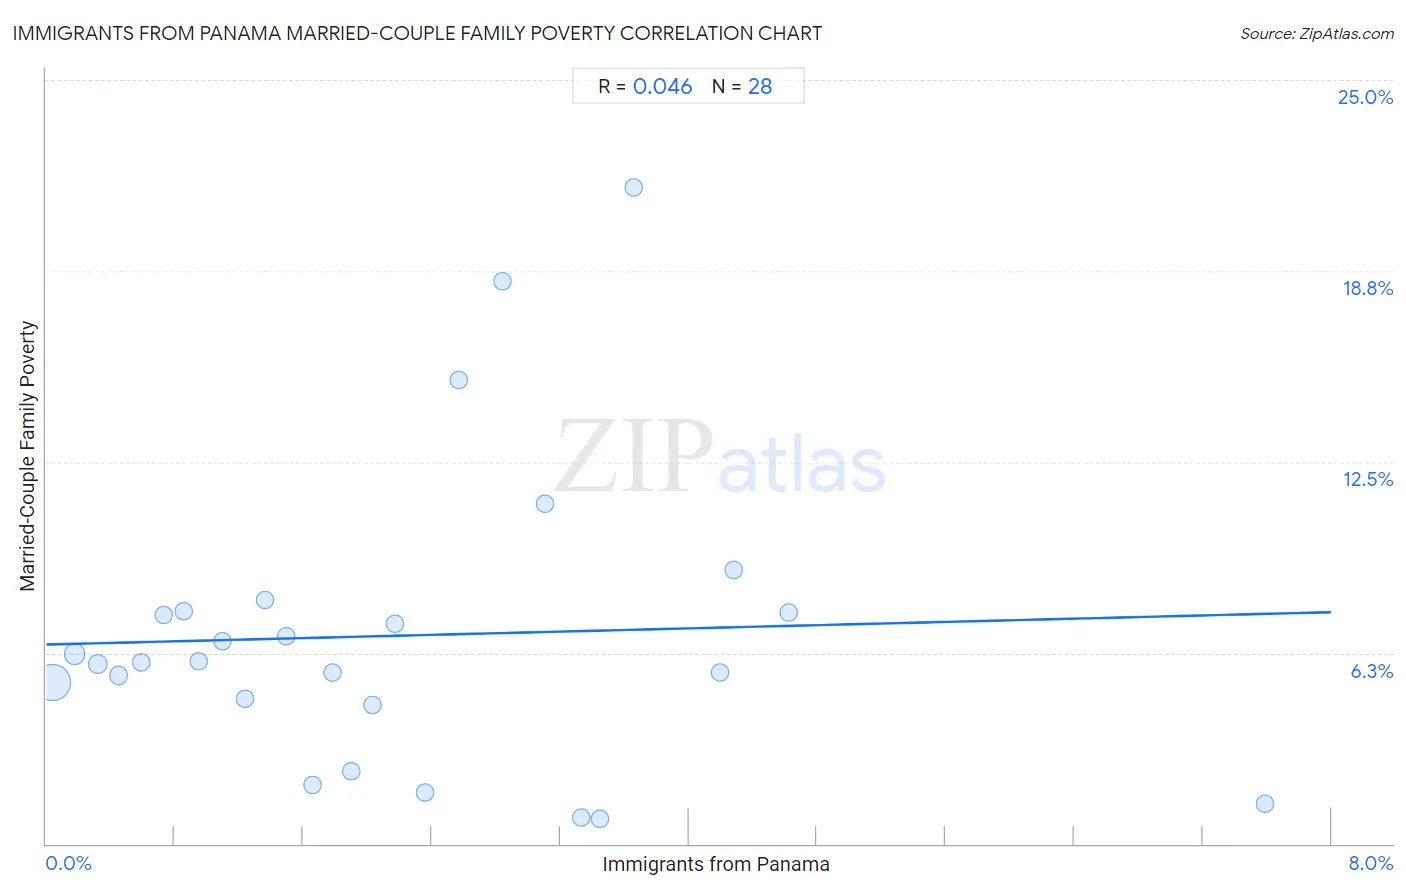
Immigrants from Panama Married-Couple Family Poverty Correlation Chart

The statistical analysis conducted on geographies consisting of 220,360,551 people shows no correlation between the proportion of Immigrants from Panama and poverty level among married-couple families in the United States with a correlation coefficient (R) of 0.046 and weighted average of 5.8%. On average, for every 1% (one percent) increase in Immigrants from Panama within a typical geography, there is an increase of 0.13% in poverty level among married-couple families.
Immigrants from Panama Married-Couple Family Poverty
It is essential to understand that the correlation between the percentage of Immigrants from Panama and poverty level among married-couple families does not imply a direct cause-and-effect relationship. It remains uncertain whether the presence of Immigrants from Panama influences an upward or downward trend in the level of poverty level among married-couple families within an area, or if Immigrants from Panama simply ended up residing in those areas with higher or lower levels of poverty level among married-couple families due to other factors.

Demographics Similar to Immigrants from Panama by Married-Couple Family Poverty

In terms of married-couple family poverty, the demographic groups most similar to Immigrants from Panama are Fijian (5.8%, a difference of 0.020%), Immigrants from Western Africa (5.8%, a difference of 0.090%), Venezuelan (5.8%, a difference of 0.19%), Cherokee (5.8%, a difference of 0.22%), and Somali (5.8%, a difference of 0.24%).
DemographicsRating | RankMarried-Couple Family Poverty
Immigrants from Uruguay
3.7
/100
|
#234
Tragic
5.7%
Immigrants from Sudan
3.5
/100
|
#235
Tragic
5.7%
Ghanaians
3.3
/100
|
#236
Tragic
5.7%
Immigrants from South America
3.1
/100
|
#237
Tragic
5.7%
Cherokee
2.7
/100
|
#238
Tragic
5.8%
Venezuelans
2.7
/100
|
#239
Tragic
5.8%
Fijians
2.5
/100
|
#240
Tragic
5.8%
Immigrants from Panama
2.5
/100
|
#241
Tragic
5.8%
Immigrants from Western Africa
2.4
/100
|
#242
Tragic
5.8%
Somalis
2.3
/100
|
#243
Tragic
5.8%
Chickasaw
2.3
/100
|
#244
Tragic
5.8%
Immigrants from Afghanistan
2.1
/100
|
#245
Tragic
5.8%
Immigrants from Venezuela
1.8
/100
|
#246
Tragic
5.8%
Iraqis
1.4
/100
|
#247
Tragic
5.9%
Cree
1.2
/100
|
#248
Tragic
5.9%

Immigrants from Panama Married-Couple Family Poverty Correlation Summary

MeasurementImmigrants from Panama DataMarried-Couple Family Poverty Data
Minimum0.042%0.83%
Maximum7.6%21.5%
Range7.5%20.6%
Mean2.2%6.8%
Median1.8%5.9%
Interquartile 25% (IQ1)0.90%4.6%
Interquartile 75% (IQ3)3.2%7.6%
Interquartile Range (IQR)2.3%2.9%
Standard Deviation (Sample)1.7%4.9%
Standard Deviation (Population)1.7%4.8%

Correlation Details

Immigrants from Panama PercentileSample SizeMarried-Couple Family Poverty
[
0.0%
-
0.5%
]
0.042%
176,887,7565.3%
[
0.0%
-
0.5%
]
0.18%
30,450,0656.2%
[
0.0%
-
0.5%
]
0.32%
6,668,2615.9%
[
0.0%
-
0.5%
]
0.45%
3,050,9005.5%
[
0.5%
-
1.0%
]
0.59%
1,443,0915.9%
[
0.5%
-
1.0%
]
0.73%
902,4277.5%
[
0.5%
-
1.0%
]
0.85%
283,5457.6%
[
0.5%
-
1.0%
]
0.95%
211,1616.0%
[
1.0%
-
1.5%
]
1.10%
164,1456.6%
[
1.0%
-
1.5%
]
1.24%
159,8744.8%
[
1.0%
-
1.5%
]
1.36%
3,8858.0%
[
1.0%
-
1.5%
]
1.49%
32,6876.8%
[
1.5%
-
2.0%
]
1.66%
18,0611.9%
[
1.5%
-
2.0%
]
1.78%
31,4195.6%
[
1.5%
-
2.0%
]
1.90%
1,8412.4%
[
2.0%
-
2.5%
]
2.03%
9,6404.5%
[
2.0%
-
2.5%
]
2.17%
4,1057.2%
[
2.0%
-
2.5%
]
2.36%
18,5461.7%
[
2.5%
-
3.0%
]
2.57%
3,77515.2%
[
2.5%
-
3.0%
]
2.84%
1,65318.4%
[
3.0%
-
3.5%
]
3.11%
64411.1%
[
3.0%
-
3.5%
]
3.33%
7,0570.86%
[
3.0%
-
3.5%
]
3.45%
5220.83%
[
3.5%
-
4.0%
]
3.66%
1,25821.5%
[
4.0%
-
4.5%
]
4.19%
1,0025.6%
[
4.0%
-
4.5%
]
4.28%
1,3328.9%
[
4.5%
-
5.0%
]
4.62%
1,3857.6%
[
7.5%
-
8.0%
]
7.59%
5141.3%