Chickasaw Receiving Food Stamps
COMPARE
Chickasaw
Select to Compare
Receiving Food Stamps
Chickasaw Receiving Food Stamps
13.1%
PUBLIC INCOME | FOOD STAMPS
3.6/ 100
METRIC RATING
226th/ 347
METRIC RANK
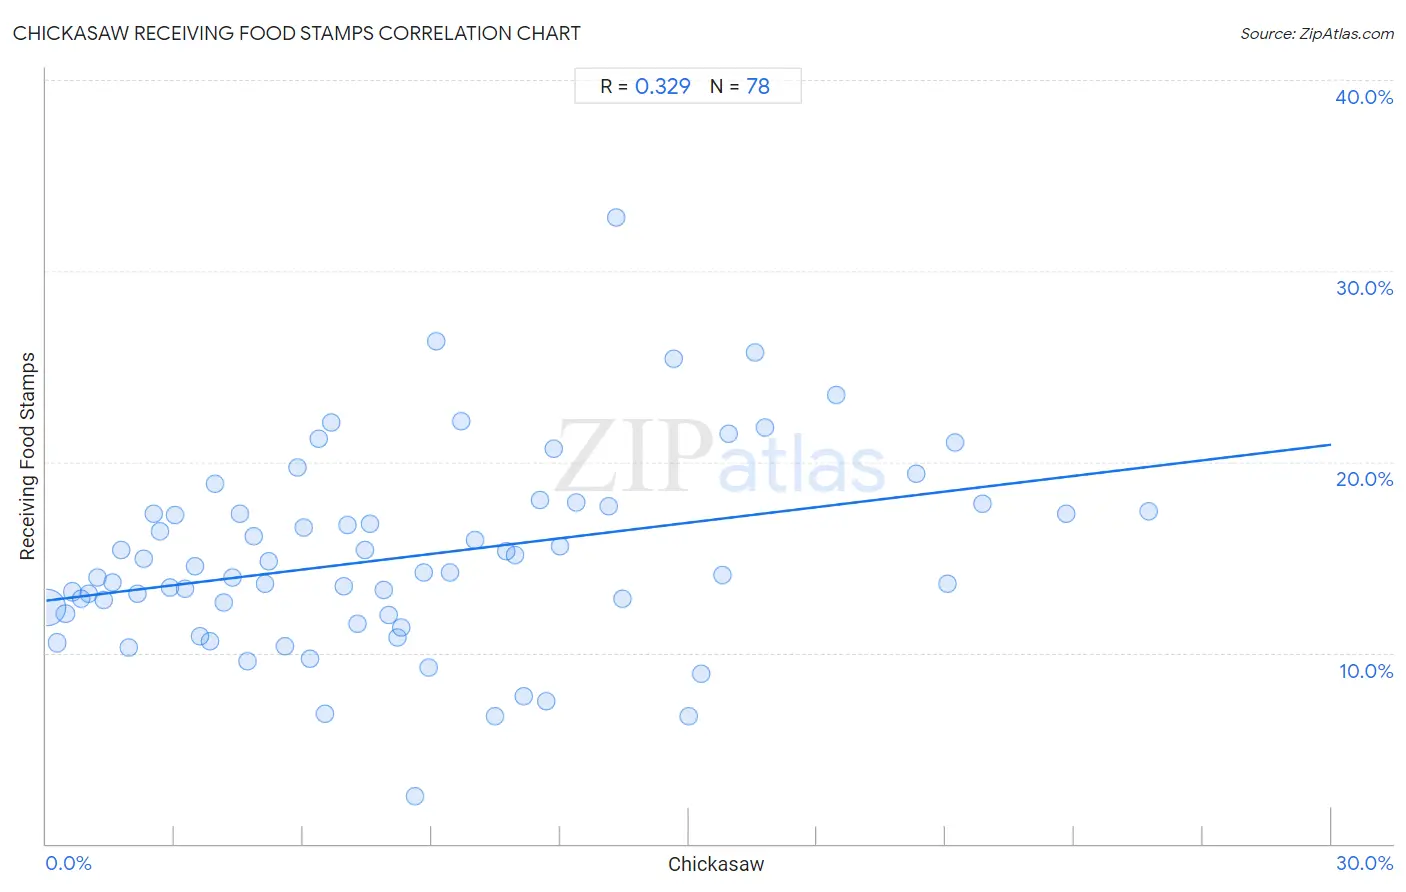
Chickasaw Receiving Food Stamps Correlation Chart
The statistical analysis conducted on geographies consisting of 147,564,346 people shows a mild positive correlation between the proportion of Chickasaw and percentage of population receiving government assistance and/or food stamps in the United States with a correlation coefficient (R) of 0.329 and weighted average of 13.1%. On average, for every 1% (one percent) increase in Chickasaw within a typical geography, there is an increase of 0.27% in percentage of population receiving government assistance and/or food stamps.
It is essential to understand that the correlation between the percentage of Chickasaw and percentage of population receiving government assistance and/or food stamps does not imply a direct cause-and-effect relationship. It remains uncertain whether the presence of Chickasaw influences an upward or downward trend in the level of percentage of population receiving government assistance and/or food stamps within an area, or if Chickasaw simply ended up residing in those areas with higher or lower levels of percentage of population receiving government assistance and/or food stamps due to other factors.
Demographics Similar to Chickasaw by Receiving Food Stamps
In terms of receiving food stamps, the demographic groups most similar to Chickasaw are Nigerian (13.1%, a difference of 0.050%), Panamanian (13.1%, a difference of 0.050%), Ottawa (13.1%, a difference of 0.070%), Puget Sound Salish (13.1%, a difference of 0.12%), and Immigrants from Nigeria (13.1%, a difference of 0.15%).
| Demographics | Rating | Rank | Receiving Food Stamps |
| Immigrants from Middle Africa | 5.4 /100 | #219 | Tragic 12.9% |
| Immigrants from Colombia | 5.3 /100 | #220 | Tragic 12.9% |
| Bermudans | 4.8 /100 | #221 | Tragic 13.0% |
| Immigrants | 4.4 /100 | #222 | Tragic 13.0% |
| Immigrants from Albania | 4.4 /100 | #223 | Tragic 13.0% |
| Immigrants from Armenia | 4.3 /100 | #224 | Tragic 13.0% |
| Fijians | 4.3 /100 | #225 | Tragic 13.0% |
| Chickasaw | 3.6 /100 | #226 | Tragic 13.1% |
| Nigerians | 3.5 /100 | #227 | Tragic 13.1% |
| Panamanians | 3.5 /100 | #228 | Tragic 13.1% |
| Ottawa | 3.5 /100 | #229 | Tragic 13.1% |
| Puget Sound Salish | 3.4 /100 | #230 | Tragic 13.1% |
| Immigrants from Nigeria | 3.4 /100 | #231 | Tragic 13.1% |
| Salvadorans | 2.7 /100 | #232 | Tragic 13.2% |
| Cherokee | 2.5 /100 | #233 | Tragic 13.2% |
Chickasaw Receiving Food Stamps Correlation Summary
| Measurement | Chickasaw Data | Receiving Food Stamps Data |
| Minimum | 0.032% | 2.5% |
| Maximum | 25.7% | 32.8% |
| Range | 25.7% | 30.3% |
| Mean | 8.4% | 15.0% |
| Median | 7.4% | 14.2% |
| Interquartile 25% (IQ1) | 3.6% | 12.0% |
| Interquartile 75% (IQ3) | 11.9% | 17.4% |
| Interquartile Range (IQR) | 8.3% | 5.4% |
| Standard Deviation (Sample) | 6.1% | 5.1% |
| Standard Deviation (Population) | 6.1% | 5.0% |
Correlation Details
| Chickasaw Percentile | Sample Size | Receiving Food Stamps |
[ 0.0% - 0.5% ] 0.032% | 136,566,306 | 12.4% |
[ 0.0% - 0.5% ] 0.25% | 5,279,507 | 10.5% |
[ 0.0% - 0.5% ] 0.45% | 1,589,463 | 12.0% |
[ 0.5% - 1.0% ] 0.60% | 1,613,456 | 13.2% |
[ 0.5% - 1.0% ] 0.83% | 822,378 | 12.8% |
[ 0.5% - 1.0% ] 0.99% | 474,840 | 13.1% |
[ 1.0% - 1.5% ] 1.19% | 233,583 | 13.9% |
[ 1.0% - 1.5% ] 1.35% | 249,739 | 12.8% |
[ 1.5% - 2.0% ] 1.54% | 89,231 | 13.7% |
[ 1.5% - 2.0% ] 1.74% | 88,533 | 15.4% |
[ 1.5% - 2.0% ] 1.93% | 53,323 | 10.3% |
[ 2.0% - 2.5% ] 2.13% | 48,029 | 13.1% |
[ 2.0% - 2.5% ] 2.28% | 55,156 | 15.0% |
[ 2.5% - 3.0% ] 2.51% | 15,979 | 17.3% |
[ 2.5% - 3.0% ] 2.66% | 16,025 | 16.3% |
[ 2.5% - 3.0% ] 2.88% | 67,875 | 13.4% |
[ 3.0% - 3.5% ] 3.00% | 18,539 | 17.2% |
[ 3.0% - 3.5% ] 3.24% | 15,996 | 13.4% |
[ 3.0% - 3.5% ] 3.46% | 7,995 | 14.5% |
[ 3.5% - 4.0% ] 3.58% | 7,909 | 10.9% |
[ 3.5% - 4.0% ] 3.83% | 1,750 | 10.6% |
[ 3.5% - 4.0% ] 3.93% | 2,773 | 18.8% |
[ 4.0% - 4.5% ] 4.14% | 4,957 | 12.7% |
[ 4.0% - 4.5% ] 4.35% | 20,308 | 13.9% |
[ 4.5% - 5.0% ] 4.53% | 26,620 | 17.3% |
[ 4.5% - 5.0% ] 4.70% | 4,529 | 9.6% |
[ 4.5% - 5.0% ] 4.86% | 2,552 | 16.1% |
[ 5.0% - 5.5% ] 5.11% | 4,603 | 13.6% |
[ 5.0% - 5.5% ] 5.18% | 40,674 | 14.8% |
[ 5.5% - 6.0% ] 5.57% | 4,596 | 10.4% |
[ 5.5% - 6.0% ] 5.86% | 290 | 19.7% |
[ 5.5% - 6.0% ] 6.00% | 4,318 | 16.5% |
[ 6.0% - 6.5% ] 6.16% | 438 | 9.7% |
[ 6.0% - 6.5% ] 6.36% | 6,967 | 21.2% |
[ 6.5% - 7.0% ] 6.51% | 215 | 6.8% |
[ 6.5% - 7.0% ] 6.65% | 1,234 | 22.0% |
[ 6.5% - 7.0% ] 6.95% | 4,633 | 13.5% |
[ 7.0% - 7.5% ] 7.04% | 1,108 | 16.7% |
[ 7.0% - 7.5% ] 7.28% | 8,632 | 11.5% |
[ 7.0% - 7.5% ] 7.45% | 2,925 | 15.4% |
[ 7.5% - 8.0% ] 7.56% | 6,148 | 16.8% |
[ 7.5% - 8.0% ] 7.88% | 2,449 | 13.3% |
[ 8.0% - 8.5% ] 8.00% | 350 | 12.0% |
[ 8.0% - 8.5% ] 8.21% | 633 | 10.8% |
[ 8.0% - 8.5% ] 8.29% | 4,329 | 11.3% |
[ 8.5% - 9.0% ] 8.60% | 651 | 2.5% |
[ 8.5% - 9.0% ] 8.81% | 919 | 14.2% |
[ 8.5% - 9.0% ] 8.92% | 975 | 9.2% |
[ 9.0% - 9.5% ] 9.11% | 966 | 26.3% |
[ 9.0% - 9.5% ] 9.44% | 4,841 | 14.2% |
[ 9.5% - 10.0% ] 9.70% | 268 | 22.1% |
[ 10.0% - 10.5% ] 10.00% | 7,518 | 15.9% |
[ 10.0% - 10.5% ] 10.49% | 286 | 6.7% |
[ 10.5% - 11.0% ] 10.75% | 930 | 15.3% |
[ 10.5% - 11.0% ] 10.95% | 5,491 | 15.1% |
[ 11.0% - 11.5% ] 11.15% | 1,283 | 7.7% |
[ 11.5% - 12.0% ] 11.54% | 208 | 18.0% |
[ 11.5% - 12.0% ] 11.68% | 1,516 | 7.4% |
[ 11.5% - 12.0% ] 11.85% | 16,537 | 20.7% |
[ 11.5% - 12.0% ] 11.98% | 31,368 | 15.6% |
[ 12.0% - 12.5% ] 12.37% | 897 | 17.9% |
[ 13.0% - 13.5% ] 13.13% | 8,460 | 17.7% |
[ 13.0% - 13.5% ] 13.31% | 3,110 | 32.8% |
[ 13.0% - 13.5% ] 13.45% | 119 | 12.8% |
[ 14.5% - 15.0% ] 14.64% | 560 | 25.4% |
[ 15.0% - 15.5% ] 15.00% | 40 | 6.7% |
[ 15.0% - 15.5% ] 15.30% | 791 | 8.9% |
[ 15.5% - 16.0% ] 15.79% | 190 | 14.1% |
[ 15.5% - 16.0% ] 15.93% | 841 | 21.4% |
[ 16.5% - 17.0% ] 16.55% | 145 | 25.7% |
[ 16.5% - 17.0% ] 16.79% | 262 | 21.8% |
[ 18.0% - 18.5% ] 18.46% | 428 | 23.5% |
[ 20.0% - 20.5% ] 20.31% | 64 | 19.4% |
[ 21.0% - 21.5% ] 21.05% | 114 | 13.6% |
[ 21.0% - 21.5% ] 21.23% | 212 | 21.0% |
[ 21.5% - 22.0% ] 21.86% | 988 | 17.8% |
[ 23.5% - 24.0% ] 23.81% | 189 | 17.3% |
[ 25.5% - 26.0% ] 25.74% | 1,286 | 17.4% |