Immigrants from Italy Married-Couple Family Poverty
COMPARE
Immigrants from Italy
Select to Compare
Married-Couple Family Poverty
Immigrants from Italy Married-Couple Family Poverty
4.6%
POVERTY | MARRIED-COUPLE FAMILIES
98.3/ 100
METRIC RATING
94th/ 347
METRIC RANK
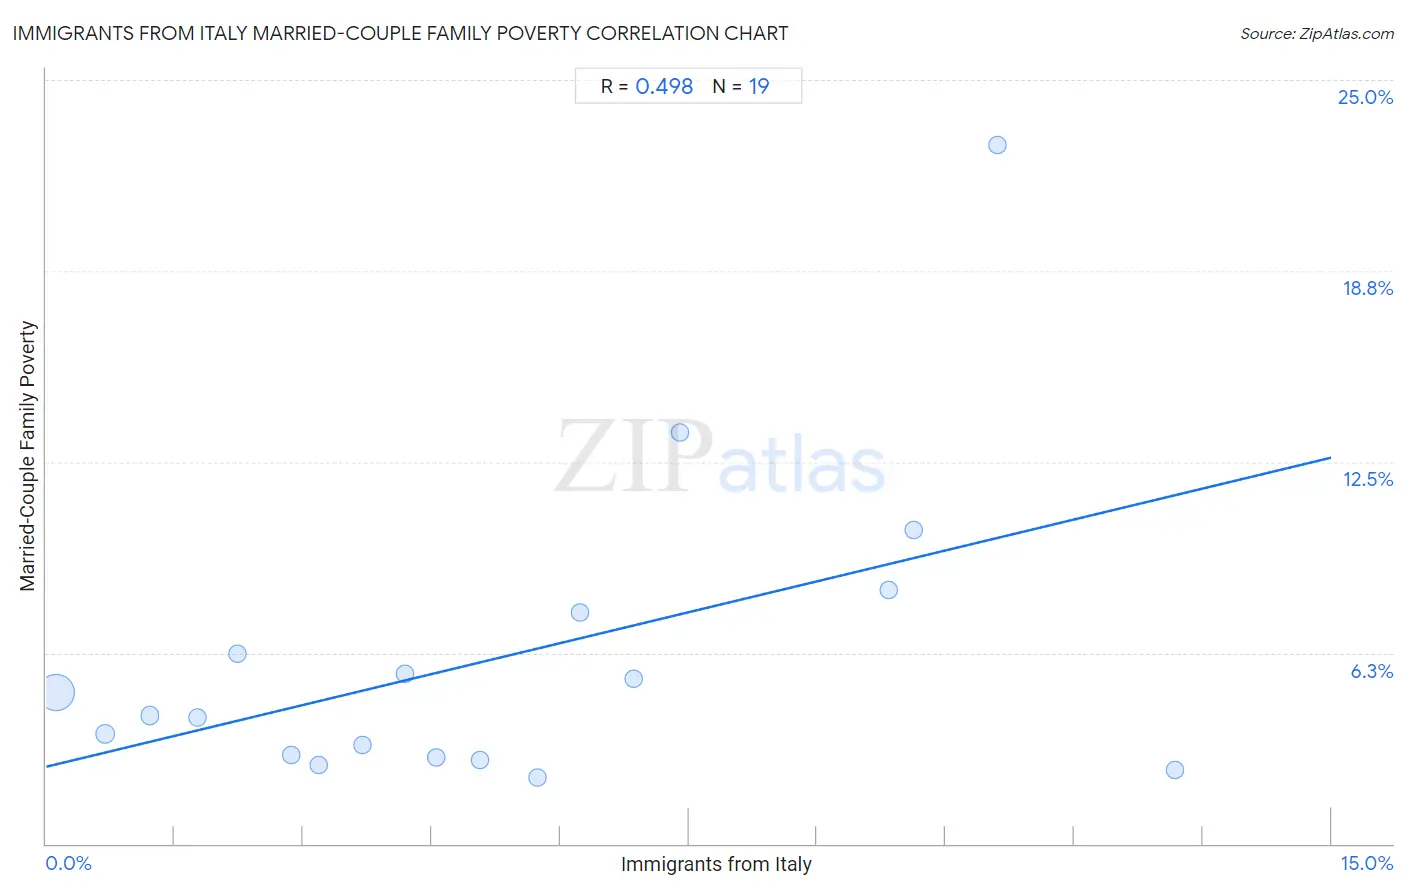
Immigrants from Italy Married-Couple Family Poverty Correlation Chart
The statistical analysis conducted on geographies consisting of 321,486,465 people shows a moderate positive correlation between the proportion of Immigrants from Italy and poverty level among married-couple families in the United States with a correlation coefficient (R) of 0.498 and weighted average of 4.6%. On average, for every 1% (one percent) increase in Immigrants from Italy within a typical geography, there is an increase of 0.67% in poverty level among married-couple families.
It is essential to understand that the correlation between the percentage of Immigrants from Italy and poverty level among married-couple families does not imply a direct cause-and-effect relationship. It remains uncertain whether the presence of Immigrants from Italy influences an upward or downward trend in the level of poverty level among married-couple families within an area, or if Immigrants from Italy simply ended up residing in those areas with higher or lower levels of poverty level among married-couple families due to other factors.
Demographics Similar to Immigrants from Italy by Married-Couple Family Poverty
In terms of married-couple family poverty, the demographic groups most similar to Immigrants from Italy are Portuguese (4.6%, a difference of 0.040%), Korean (4.6%, a difference of 0.050%), Immigrants from Poland (4.6%, a difference of 0.12%), Immigrants from Belgium (4.6%, a difference of 0.17%), and Immigrants from Norway (4.6%, a difference of 0.23%).
| Demographics | Rating | Rank | Married-Couple Family Poverty |
| Immigrants from North Macedonia | 98.6 /100 | #87 | Exceptional 4.6% |
| Bolivians | 98.6 /100 | #88 | Exceptional 4.6% |
| Immigrants from Czechoslovakia | 98.5 /100 | #89 | Exceptional 4.6% |
| Immigrants from Switzerland | 98.5 /100 | #90 | Exceptional 4.6% |
| Basques | 98.5 /100 | #91 | Exceptional 4.6% |
| Immigrants from Norway | 98.4 /100 | #92 | Exceptional 4.6% |
| Koreans | 98.3 /100 | #93 | Exceptional 4.6% |
| Immigrants from Italy | 98.3 /100 | #94 | Exceptional 4.6% |
| Portuguese | 98.3 /100 | #95 | Exceptional 4.6% |
| Immigrants from Poland | 98.3 /100 | #96 | Exceptional 4.6% |
| Immigrants from Belgium | 98.2 /100 | #97 | Exceptional 4.6% |
| Native Hawaiians | 98.0 /100 | #98 | Exceptional 4.6% |
| Immigrants from Europe | 97.9 /100 | #99 | Exceptional 4.6% |
| Immigrants from Western Europe | 97.9 /100 | #100 | Exceptional 4.6% |
| Yugoslavians | 97.8 /100 | #101 | Exceptional 4.6% |
Immigrants from Italy Married-Couple Family Poverty Correlation Summary
| Measurement | Immigrants from Italy Data | Married-Couple Family Poverty Data |
| Minimum | 0.12% | 2.2% |
| Maximum | 13.2% | 22.9% |
| Range | 13.1% | 20.7% |
| Mean | 5.3% | 6.1% |
| Median | 4.6% | 4.2% |
| Interquartile 25% (IQ1) | 2.2% | 2.8% |
| Interquartile 75% (IQ3) | 7.4% | 7.6% |
| Interquartile Range (IQR) | 5.2% | 4.7% |
| Standard Deviation (Sample) | 3.7% | 5.0% |
| Standard Deviation (Population) | 3.6% | 4.9% |
Correlation Details
| Immigrants from Italy Percentile | Sample Size | Married-Couple Family Poverty |
[ 0.0% - 0.5% ] 0.12% | 300,946,276 | 4.9% |
[ 0.5% - 1.0% ] 0.68% | 14,706,272 | 3.6% |
[ 1.0% - 1.5% ] 1.21% | 3,357,502 | 4.2% |
[ 1.5% - 2.0% ] 1.76% | 1,115,765 | 4.1% |
[ 2.0% - 2.5% ] 2.23% | 779,148 | 6.2% |
[ 2.5% - 3.0% ] 2.86% | 121,795 | 2.9% |
[ 3.0% - 3.5% ] 3.18% | 201,958 | 2.6% |
[ 3.5% - 4.0% ] 3.70% | 79,861 | 3.2% |
[ 4.0% - 4.5% ] 4.19% | 124,701 | 5.6% |
[ 4.5% - 5.0% ] 4.55% | 7,162 | 2.8% |
[ 5.0% - 5.5% ] 5.07% | 33,004 | 2.8% |
[ 5.5% - 6.0% ] 5.73% | 698 | 2.2% |
[ 6.0% - 6.5% ] 6.23% | 3,131 | 7.6% |
[ 6.5% - 7.0% ] 6.86% | 2,069 | 5.4% |
[ 7.0% - 7.5% ] 7.39% | 2,679 | 13.5% |
[ 9.5% - 10.0% ] 9.84% | 691 | 8.3% |
[ 10.0% - 10.5% ] 10.13% | 602 | 10.3% |
[ 11.0% - 11.5% ] 11.11% | 153 | 22.9% |
[ 13.0% - 13.5% ] 13.18% | 2,998 | 2.4% |