Spanish Married-Couple Family Poverty
COMPARE
Spanish
Select to Compare
Married-Couple Family Poverty
Spanish Married-Couple Family Poverty
5.3%
POVERTY | MARRIED-COUPLE FAMILIES
41.4/ 100
METRIC RATING
179th/ 347
METRIC RANK
Spanish Married-Couple Family Poverty Correlation Chart
The statistical analysis conducted on geographies consisting of 418,282,486 people shows a weak positive correlation between the proportion of Spanish and poverty level among married-couple families in the United States with a correlation coefficient (R) of 0.280 and weighted average of 5.3%. On average, for every 1% (one percent) increase in Spanish within a typical geography, there is an increase of 0.13% in poverty level among married-couple families.
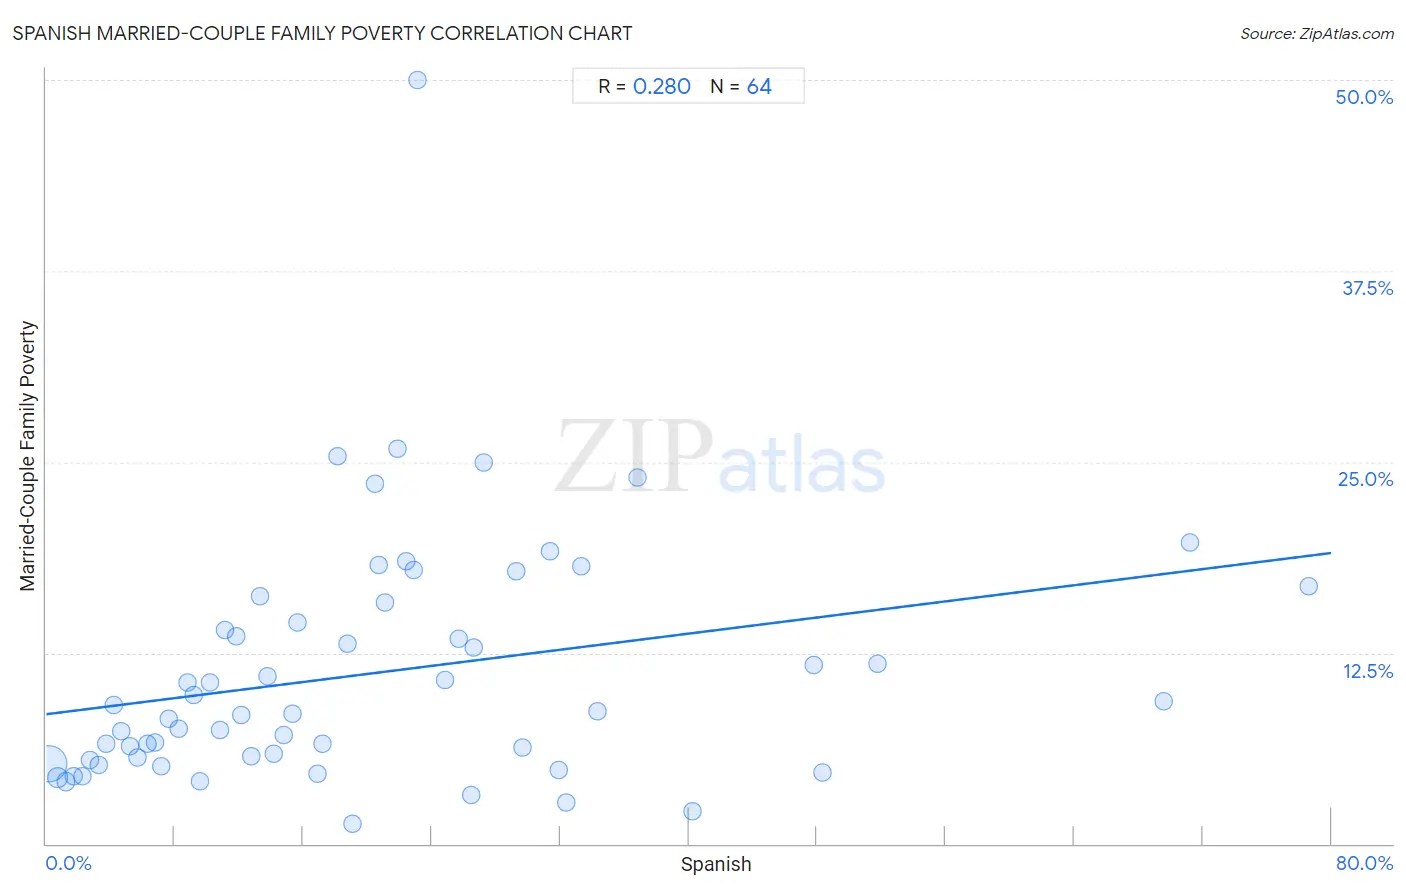
It is essential to understand that the correlation between the percentage of Spanish and poverty level among married-couple families does not imply a direct cause-and-effect relationship. It remains uncertain whether the presence of Spanish influences an upward or downward trend in the level of poverty level among married-couple families within an area, or if Spanish simply ended up residing in those areas with higher or lower levels of poverty level among married-couple families due to other factors.
Demographics Similar to Spanish by Married-Couple Family Poverty
In terms of married-couple family poverty, the demographic groups most similar to Spanish are Immigrants from Sierra Leone (5.3%, a difference of 0.25%), Immigrants from Chile (5.3%, a difference of 0.31%), Immigrants from Ukraine (5.2%, a difference of 0.42%), Immigrants from Kazakhstan (5.2%, a difference of 0.44%), and Immigrants from Vietnam (5.3%, a difference of 0.44%).
| Demographics | Rating | Rank | Married-Couple Family Poverty |
| Immigrants from Northern Africa | 51.3 /100 | #172 | Average 5.2% |
| Alsatians | 51.2 /100 | #173 | Average 5.2% |
| Immigrants from Eastern Africa | 50.0 /100 | #174 | Average 5.2% |
| Marshallese | 47.9 /100 | #175 | Average 5.2% |
| Menominee | 47.8 /100 | #176 | Average 5.2% |
| Immigrants from Kazakhstan | 45.1 /100 | #177 | Average 5.2% |
| Immigrants from Ukraine | 44.9 /100 | #178 | Average 5.2% |
| Spanish | 41.4 /100 | #179 | Average 5.3% |
| Immigrants from Sierra Leone | 39.3 /100 | #180 | Fair 5.3% |
| Immigrants from Chile | 38.8 /100 | #181 | Fair 5.3% |
| Immigrants from Vietnam | 37.7 /100 | #182 | Fair 5.3% |
| Peruvians | 37.6 /100 | #183 | Fair 5.3% |
| Nonimmigrants | 35.8 /100 | #184 | Fair 5.3% |
| Americans | 35.4 /100 | #185 | Fair 5.3% |
| Hungarians | 34.7 /100 | #186 | Fair 5.3% |
Spanish Married-Couple Family Poverty Correlation Summary
| Measurement | Spanish Data | Married-Couple Family Poverty Data |
| Minimum | 0.18% | 1.3% |
| Maximum | 78.6% | 50.0% |
| Range | 78.4% | 48.7% |
| Mean | 20.2% | 11.1% |
| Median | 16.3% | 8.6% |
| Interquartile 25% (IQ1) | 7.9% | 5.6% |
| Interquartile 75% (IQ3) | 26.9% | 15.2% |
| Interquartile Range (IQR) | 19.0% | 9.6% |
| Standard Deviation (Sample) | 17.1% | 8.0% |
| Standard Deviation (Population) | 16.9% | 8.0% |
Correlation Details
| Spanish Percentile | Sample Size | Married-Couple Family Poverty |
[ 0.0% - 0.5% ] 0.18% | 354,793,084 | 5.2% |
[ 0.5% - 1.0% ] 0.68% | 43,019,672 | 4.4% |
[ 1.0% - 1.5% ] 1.21% | 11,693,307 | 4.1% |
[ 1.5% - 2.0% ] 1.73% | 3,204,128 | 4.4% |
[ 2.0% - 2.5% ] 2.22% | 1,353,793 | 4.4% |
[ 2.5% - 3.0% ] 2.75% | 859,462 | 5.5% |
[ 3.0% - 3.5% ] 3.29% | 369,077 | 5.2% |
[ 3.5% - 4.0% ] 3.77% | 302,453 | 6.5% |
[ 4.0% - 4.5% ] 4.17% | 524,130 | 9.1% |
[ 4.5% - 5.0% ] 4.65% | 885,824 | 7.4% |
[ 5.0% - 5.5% ] 5.18% | 379,900 | 6.4% |
[ 5.5% - 6.0% ] 5.67% | 123,256 | 5.6% |
[ 6.0% - 6.5% ] 6.32% | 108,507 | 6.6% |
[ 6.5% - 7.0% ] 6.80% | 136,956 | 6.6% |
[ 7.0% - 7.5% ] 7.20% | 48,949 | 5.1% |
[ 7.5% - 8.0% ] 7.63% | 131,969 | 8.2% |
[ 8.0% - 8.5% ] 8.26% | 54,802 | 7.5% |
[ 8.5% - 9.0% ] 8.80% | 69,933 | 10.5% |
[ 9.0% - 9.5% ] 9.18% | 29,810 | 9.7% |
[ 9.5% - 10.0% ] 9.61% | 15,157 | 4.1% |
[ 10.0% - 10.5% ] 10.18% | 17,596 | 10.6% |
[ 10.5% - 11.0% ] 10.79% | 9,608 | 7.4% |
[ 11.0% - 11.5% ] 11.12% | 52,715 | 14.0% |
[ 11.5% - 12.0% ] 11.83% | 3,560 | 13.6% |
[ 12.0% - 12.5% ] 12.15% | 8,927 | 8.4% |
[ 12.5% - 13.0% ] 12.77% | 5,810 | 5.7% |
[ 13.0% - 13.5% ] 13.30% | 3,452 | 16.2% |
[ 13.5% - 14.0% ] 13.81% | 2,651 | 10.9% |
[ 14.0% - 14.5% ] 14.19% | 8,744 | 5.9% |
[ 14.5% - 15.0% ] 14.76% | 1,423 | 7.1% |
[ 15.0% - 15.5% ] 15.35% | 5,771 | 8.5% |
[ 15.5% - 16.0% ] 15.62% | 2,240 | 14.5% |
[ 16.5% - 17.0% ] 16.88% | 3,809 | 4.6% |
[ 17.0% - 17.5% ] 17.17% | 3,367 | 6.5% |
[ 18.0% - 18.5% ] 18.11% | 403 | 25.3% |
[ 18.5% - 19.0% ] 18.73% | 4,016 | 13.1% |
[ 19.0% - 19.5% ] 19.06% | 1,296 | 1.3% |
[ 20.0% - 20.5% ] 20.49% | 288 | 23.5% |
[ 20.5% - 21.0% ] 20.67% | 2,675 | 18.2% |
[ 21.0% - 21.5% ] 21.06% | 4,369 | 15.8% |
[ 21.5% - 22.0% ] 21.84% | 261 | 25.8% |
[ 22.0% - 22.5% ] 22.40% | 4,946 | 18.5% |
[ 22.5% - 23.0% ] 22.88% | 4,078 | 17.9% |
[ 23.0% - 23.5% ] 23.08% | 455 | 50.0% |
[ 24.5% - 25.0% ] 24.80% | 512 | 10.8% |
[ 25.5% - 26.0% ] 25.68% | 1,172 | 13.4% |
[ 26.0% - 26.5% ] 26.50% | 1,185 | 3.2% |
[ 26.5% - 27.0% ] 26.60% | 861 | 12.9% |
[ 27.0% - 27.5% ] 27.27% | 154 | 25.0% |
[ 29.0% - 29.5% ] 29.24% | 383 | 17.8% |
[ 29.5% - 30.0% ] 29.64% | 6,157 | 6.3% |
[ 31.0% - 31.5% ] 31.37% | 357 | 19.1% |
[ 31.5% - 32.0% ] 31.93% | 880 | 4.9% |
[ 32.0% - 32.5% ] 32.38% | 667 | 2.7% |
[ 33.0% - 33.5% ] 33.33% | 618 | 18.2% |
[ 34.0% - 34.5% ] 34.29% | 1,598 | 8.7% |
[ 36.5% - 37.0% ] 36.81% | 1,513 | 24.0% |
[ 40.0% - 40.5% ] 40.26% | 688 | 2.1% |
[ 47.5% - 48.0% ] 47.82% | 1,583 | 11.7% |
[ 48.0% - 48.5% ] 48.34% | 362 | 4.7% |
[ 51.5% - 52.0% ] 51.75% | 1,687 | 11.8% |
[ 69.5% - 70.0% ] 69.57% | 1,055 | 9.3% |
[ 71.0% - 71.5% ] 71.19% | 2,322 | 19.7% |
[ 78.5% - 79.0% ] 78.60% | 2,103 | 16.9% |