Turkish Married-Couple Family Poverty

COMPARE

Turkish
Race
Ancestry
AfghanAfricanAlaska NativeAlaskan AthabascanAlbanianAleutAlsatianAmericanApacheArabArapahoArgentineanArmenianAssyrian/Chaldean/SyriacAustralianAustrianBahamianBangladeshiBarbadianBasqueBelgianBelizeanBermudanBhutaneseBlackfeetBolivianBrazilianBritishBritish West IndianBulgarianBurmeseCajunCambodianCanadianCape VerdeanCarpatho RusynCelticCentral AmericanCentral American IndianCherokeeCheyenneChickasawChileanChineseChippewaChoctawColombianColvilleComancheCosta RicanCreeCreekCroatianCrowCubanCypriotCzechCzechoslovakianDanishDelawareDominicanDutchDutch West IndianEastern EuropeanEcuadorianEgyptianEnglishEstonianEthiopianEuropeanFijianFilipinoFinnishFrenchFrench American IndianFrench CanadianGermanGerman RussianGhanaianGreekGuamanian/ChamorroGuatemalanGuyaneseHaitianHmongHonduranHopiHoumaHungarianIcelanderIndian (Asian)IndonesianInupiatIranianIraqiIrishIroquoisIsraeliItalianJamaicanJapaneseJordanianKenyanKiowaKoreanLaotianLatvianLebaneseLiberianLithuanianLumbeeLuxembourgerMacedonianMalaysianMalteseMarshalleseMenomineeMexicanMexican American IndianMongolianMoroccanNative HawaiianNavajoNepaleseNew ZealanderNicaraguanNigerianNorthern EuropeanNorwegianOkinawanOsageOttawaPaiutePakistaniPalestinianPanamanianParaguayanPennsylvania GermanPeruvianPimaPolishPortuguesePotawatomiPuebloPuerto RicanPuget Sound SalishRomanianRussianSalvadoranSamoanScandinavianScotch-IrishScottishSeminoleSenegaleseSerbianShoshoneSierra LeoneanSiouxSlavicSlovakSloveneSomaliSouth AfricanSouth AmericanSouth American IndianSoviet UnionSpaniardSpanishSpanish AmericanSpanish American IndianSri LankanSubsaharan AfricanSudaneseSwedishSwissSyrianTaiwaneseThaiTlingit-HaidaTohono O'OdhamTonganTrinidadian and TobagonianTsimshianTurkishU.S. Virgin IslanderUgandanUkrainianUruguayanUteVenezuelanVietnameseWelshWest IndianYakamaYaquiYugoslavianYumanYup'ikZimbabwean
Immigration
NonimmigrantsImmigrantsAfghanistanAfricaAlbaniaArgentinaArmeniaAsiaAustraliaAustriaBahamasBangladeshBarbadosBelarusBelgiumBelizeBoliviaBosnia and HerzegovinaBrazilBulgariaBurma/MyanmarCabo VerdeCambodiaCameroonCanadaCaribbeanCentral AmericaChileChinaColombiaCongoCosta RicaCroatiaCubaCzechoslovakiaDenmarkDominicaDominican RepublicEastern AfricaEastern AsiaEastern EuropeEcuadorEgyptEl SalvadorEnglandEritreaEthiopiaEuropeFijiFranceGermanyGhanaGreeceGrenadaGuatemalaGuyanaHaitiHondurasHong KongHungaryIndiaIndonesiaIranIraqIrelandIsraelItalyJamaicaJapanJordanKazakhstanKenyaKoreaKuwaitLaosLatin AmericaLatviaLebanonLiberiaLithuaniaMalaysiaMexicoMicronesiaMiddle AfricaMoldovaMoroccoNepalNetherlandsNicaraguaNigeriaNorth AmericaNorth MacedoniaNorthern AfricaNorthern EuropeNorwayOceaniaPakistanPanamaPeruPhilippinesPolandPortugalRomaniaRussiaSaudi ArabiaScotlandSenegalSerbiaSierra LeoneSingaporeSomaliaSouth AfricaSouth AmericaSouth Central AsiaSouth Eastern AsiaSouthern EuropeSpainSri LankaSt. Vincent and the GrenadinesSudanSwedenSwitzerlandSyriaTaiwanThailandTrinidad and TobagoTurkeyUgandaUkraineUruguayUzbekistanVenezuelaVietnamWest IndiesWestern AfricaWestern AsiaWestern EuropeYemenZaireZimbabweAzores
Select to Compare
Race
Ancestry
AfghanAfricanAlaska NativeAlaskan AthabascanAlbanianAleutAlsatianAmericanApacheArabArapahoArgentineanArmenianAssyrian/Chaldean/SyriacAustralianAustrianBahamianBangladeshiBarbadianBasqueBelgianBelizeanBermudanBhutaneseBlackfeetBolivianBrazilianBritishBritish West IndianBulgarianBurmeseCajunCambodianCanadianCape VerdeanCarpatho RusynCelticCentral AmericanCentral American IndianCherokeeCheyenneChickasawChileanChineseChippewaChoctawColombianColvilleComancheCosta RicanCreeCreekCroatianCrowCubanCypriotCzechCzechoslovakianDanishDelawareDominicanDutchDutch West IndianEastern EuropeanEcuadorianEgyptianEnglishEstonianEthiopianEuropeanFijianFilipinoFinnishFrenchFrench American IndianFrench CanadianGermanGerman RussianGhanaianGreekGuamanian/ChamorroGuatemalanGuyaneseHaitianHmongHonduranHopiHoumaHungarianIcelanderIndian (Asian)IndonesianInupiatIranianIraqiIrishIroquoisIsraeliItalianJamaicanJapaneseJordanianKenyanKiowaKoreanLaotianLatvianLebaneseLiberianLithuanianLumbeeLuxembourgerMacedonianMalaysianMalteseMarshalleseMenomineeMexicanMexican American IndianMongolianMoroccanNative HawaiianNavajoNepaleseNew ZealanderNicaraguanNigerianNorthern EuropeanNorwegianOkinawanOsageOttawaPaiutePakistaniPalestinianPanamanianParaguayanPennsylvania GermanPeruvianPimaPolishPortuguesePotawatomiPuebloPuerto RicanPuget Sound SalishRomanianRussianSalvadoranSamoanScandinavianScotch-IrishScottishSeminoleSenegaleseSerbianShoshoneSierra LeoneanSiouxSlavicSlovakSloveneSomaliSouth AfricanSouth AmericanSouth American IndianSoviet UnionSpaniardSpanishSpanish AmericanSpanish American IndianSri LankanSubsaharan AfricanSudaneseSwedishSwissSyrianTaiwaneseThaiTlingit-HaidaTohono O'OdhamTonganTrinidadian and TobagonianTsimshianU.S. Virgin IslanderUgandanUkrainianUruguayanUteVenezuelanVietnameseWelshWest IndianYakamaYaquiYugoslavianYumanYup'ikZimbabwean
Immigration
NonimmigrantsImmigrantsAfghanistanAfricaAlbaniaArgentinaArmeniaAsiaAustraliaAustriaBahamasBangladeshBarbadosBelarusBelgiumBelizeBoliviaBosnia and HerzegovinaBrazilBulgariaBurma/MyanmarCabo VerdeCambodiaCameroonCanadaCaribbeanCentral AmericaChileChinaColombiaCongoCosta RicaCroatiaCubaCzechoslovakiaDenmarkDominicaDominican RepublicEastern AfricaEastern AsiaEastern EuropeEcuadorEgyptEl SalvadorEnglandEritreaEthiopiaEuropeFijiFranceGermanyGhanaGreeceGrenadaGuatemalaGuyanaHaitiHondurasHong KongHungaryIndiaIndonesiaIranIraqIrelandIsraelItalyJamaicaJapanJordanKazakhstanKenyaKoreaKuwaitLaosLatin AmericaLatviaLebanonLiberiaLithuaniaMalaysiaMexicoMicronesiaMiddle AfricaMoldovaMoroccoNepalNetherlandsNicaraguaNigeriaNorth AmericaNorth MacedoniaNorthern AfricaNorthern EuropeNorwayOceaniaPakistanPanamaPeruPhilippinesPolandPortugalRomaniaRussiaSaudi ArabiaScotlandSenegalSerbiaSierra LeoneSingaporeSomaliaSouth AfricaSouth AmericaSouth Central AsiaSouth Eastern AsiaSouthern EuropeSpainSri LankaSt. Vincent and the GrenadinesSudanSwedenSwitzerlandSyriaTaiwanThailandTrinidad and TobagoTurkeyUgandaUkraineUruguayUzbekistanVenezuelaVietnamWest IndiesWestern AfricaWestern AsiaWestern EuropeYemenZaireZimbabweAzores
Married-Couple Family Poverty
Income
Poverty
Unemployment
Labor Participation
Family Structure
Vehicle Availability
Education Level
Disability

Turkish Married-Couple Family Poverty
Exceptional

4.4%
POVERTY | MARRIED-COUPLE FAMILIES
93.6/ 100
METRIC RATING
62nd/ 347
METRIC RANK

Turkish Married-Couple Family Poverty Correlation Chart

The statistical analysis conducted on geographies consisting of 266,241,391 people shows a mild positive correlation between the proportion of Turks and poverty level among married-couple families in the United States with a correlation coefficient (R) of 0.379 and weighted average of 4.4%. On average, for every 1% (one percent) increase in Turks within a typical geography, there is an increase of 0.64% in poverty level among married-couple families.
Turkish Married-Couple Family Poverty
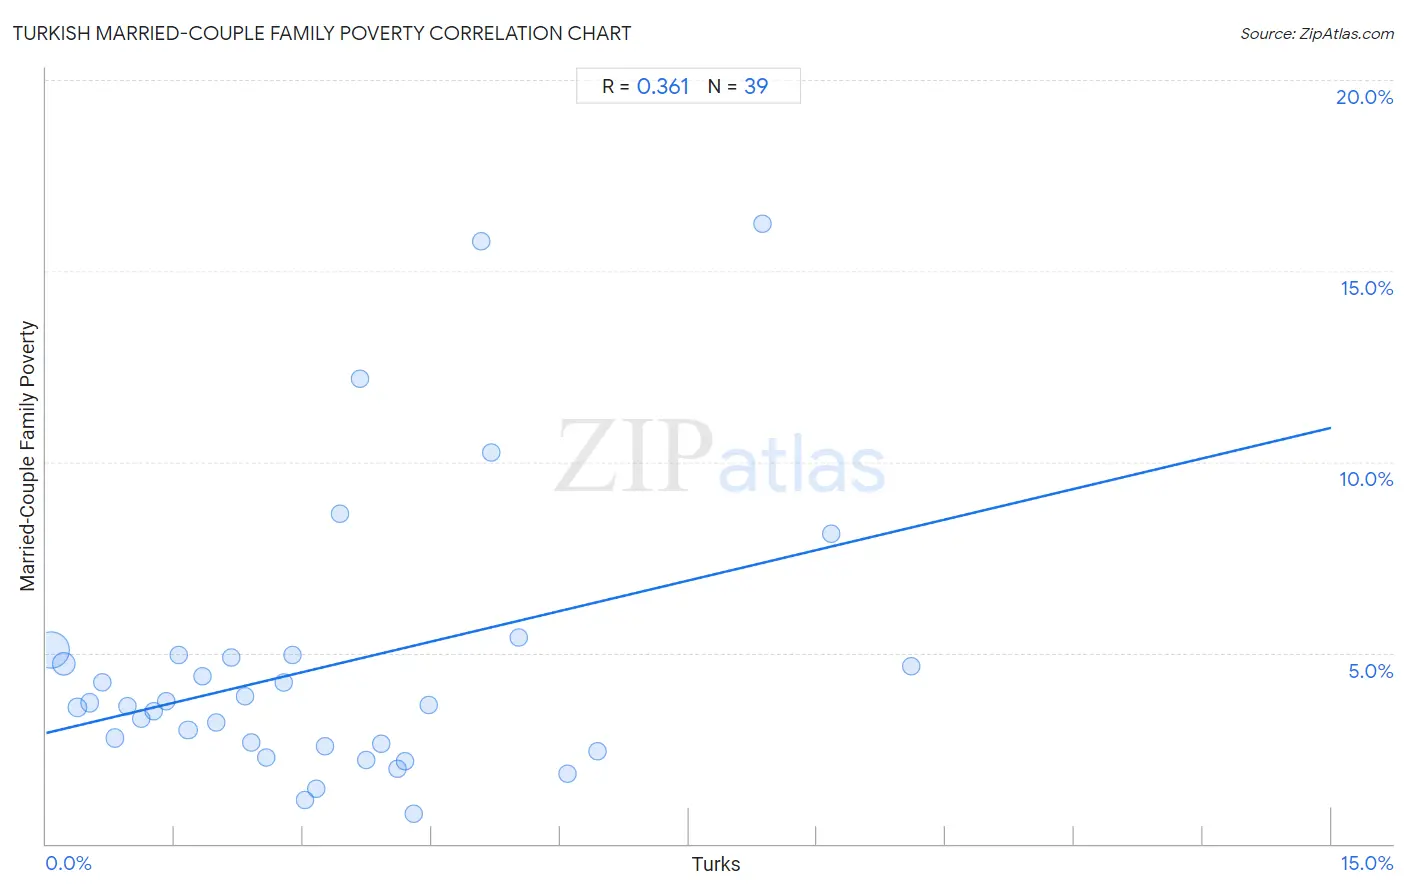
It is essential to understand that the correlation between the percentage of Turks and poverty level among married-couple families does not imply a direct cause-and-effect relationship. It remains uncertain whether the presence of Turks influences an upward or downward trend in the level of poverty level among married-couple families within an area, or if Turks simply ended up residing in those areas with higher or lower levels of poverty level among married-couple families due to other factors.

Demographics Similar to Turks by Married-Couple Family Poverty

In terms of married-couple family poverty, the demographic groups most similar to Turks are Immigrants from Turkey (4.4%, a difference of 0.31%), New Zealander (4.4%, a difference of 0.38%), Korean (4.4%, a difference of 0.39%), Ukrainian (4.4%, a difference of 0.40%), and Welsh (4.4%, a difference of 0.74%).
DemographicsRating | RankMarried-Couple Family Poverty
Immigrants from South Central Asia
94.3
/100
|
#55
Exceptional
4.3%
Immigrants from Australia
94.2
/100
|
#56
Exceptional
4.3%
French
94.2
/100
|
#57
Exceptional
4.3%
Australians
94.0
/100
|
#58
Exceptional
4.4%
Welsh
93.9
/100
|
#59
Exceptional
4.4%
Koreans
93.7
/100
|
#60
Exceptional
4.4%
New Zealanders
93.7
/100
|
#61
Exceptional
4.4%
Turks
93.6
/100
|
#62
Exceptional
4.4%
Immigrants from Turkey
93.5
/100
|
#63
Exceptional
4.4%
Ukrainians
93.5
/100
|
#64
Exceptional
4.4%
Immigrants from Serbia
93.3
/100
|
#65
Exceptional
4.4%
Immigrants from Greece
93.3
/100
|
#66
Exceptional
4.4%
Immigrants from Switzerland
93.3
/100
|
#67
Exceptional
4.4%
Slavs
93.3
/100
|
#68
Exceptional
4.4%
Immigrants from Sri Lanka
93.3
/100
|
#69
Exceptional
4.4%

Turkish Married-Couple Family Poverty Correlation Summary

MeasurementTurkish DataMarried-Couple Family Poverty Data
Minimum0.061%1.1%
Maximum10.9%22.7%
Range10.9%21.7%
Mean3.4%5.7%
Median3.0%4.4%
Interquartile 25% (IQ1)1.5%3.2%
Interquartile 75% (IQ3)4.6%6.6%
Interquartile Range (IQR)3.2%3.4%
Standard Deviation (Sample)2.6%4.4%
Standard Deviation (Population)2.6%4.4%

Correlation Details

Turkish PercentileSample SizeMarried-Couple Family Poverty
[
0.0%
-
0.5%
]
0.061%
188,506,9965.2%
[
0.0%
-
0.5%
]
0.20%
47,320,4224.7%
[
0.0%
-
0.5%
]
0.36%
12,789,9913.5%
[
0.5%
-
1.0%
]
0.51%
6,833,2473.8%
[
0.5%
-
1.0%
]
0.67%
3,913,4764.3%
[
0.5%
-
1.0%
]
0.81%
2,446,4283.3%
[
0.5%
-
1.0%
]
0.95%
988,9373.1%
[
1.0%
-
1.5%
]
1.13%
769,3033.3%
[
1.0%
-
1.5%
]
1.28%
558,5483.6%
[
1.0%
-
1.5%
]
1.40%
596,4215.0%
[
1.5%
-
2.0%
]
1.56%
311,2554.7%
[
1.5%
-
2.0%
]
1.71%
233,8953.8%
[
1.5%
-
2.0%
]
1.88%
181,8164.3%
[
1.5%
-
2.0%
]
1.99%
198,0503.1%
[
2.0%
-
2.5%
]
2.17%
133,2094.5%
[
2.0%
-
2.5%
]
2.35%
30,1145.6%
[
2.5%
-
3.0%
]
2.52%
62,2271.7%
[
2.5%
-
3.0%
]
2.55%
88,1692.3%
[
2.5%
-
3.0%
]
2.75%
6,13915.0%
[
2.5%
-
3.0%
]
2.88%
26,7312.4%
[
3.0%
-
3.5%
]
3.05%
36,6921.8%
[
3.0%
-
3.5%
]
3.19%
27,1821.1%
[
3.0%
-
3.5%
]
3.32%
17,0295.3%
[
3.0%
-
3.5%
]
3.47%
4039.1%
[
3.5%
-
4.0%
]
3.64%
4,4193.8%
[
3.5%
-
4.0%
]
3.74%
18,6134.8%
[
3.5%
-
4.0%
]
3.99%
13,6134.6%
[
4.0%
-
4.5%
]
4.21%
38011.3%
[
4.0%
-
4.5%
]
4.37%
27,2911.2%
[
4.5%
-
5.0%
]
4.52%
30,28011.4%
[
4.5%
-
5.0%
]
4.78%
10,71511.9%
[
4.5%
-
5.0%
]
4.99%
5,6345.5%
[
5.0%
-
5.5%
]
5.33%
3,4169.8%
[
5.5%
-
6.0%
]
5.61%
6602.3%
[
5.5%
-
6.0%
]
5.75%
8722.7%
[
6.5%
-
7.0%
]
6.61%
22,0261.9%
[
7.5%
-
8.0%
]
7.92%
7,0193.5%
[
8.0%
-
8.5%
]
8.47%
11,04212.2%
[
9.5%
-
10.0%
]
9.74%
4,42310.3%
[
10.5%
-
11.0%
]
10.94%
5,0937.5%