Dutch West Indian Married-Couple Family Poverty
COMPARE
Dutch West Indian
Select to Compare
Married-Couple Family Poverty
Dutch West Indian Married-Couple Family Poverty
6.4%
POVERTY | MARRIED-COUPLE FAMILIES
0.0/ 100
METRIC RATING
284th/ 347
METRIC RANK
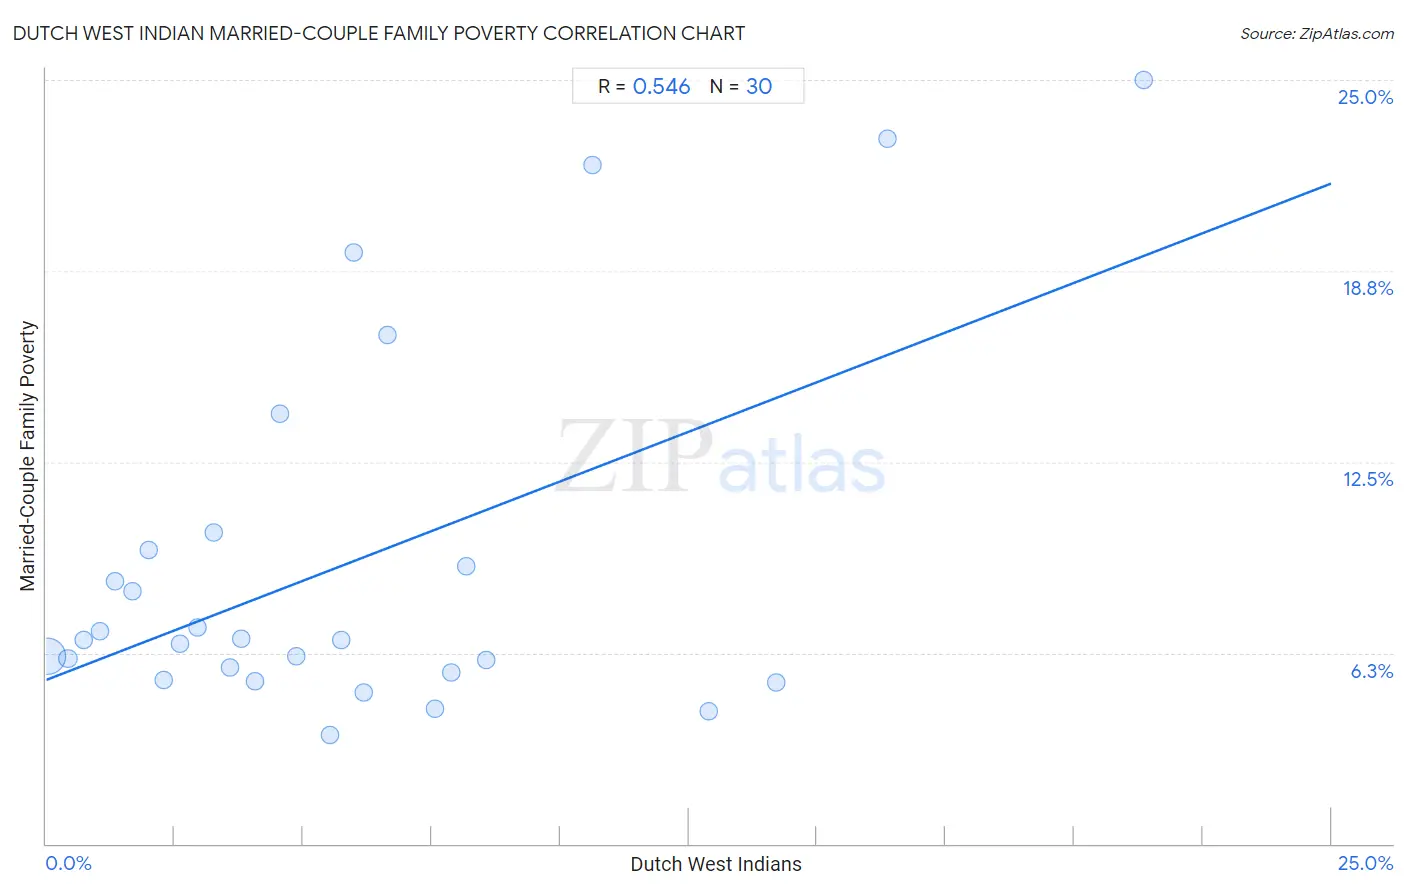
Dutch West Indian Married-Couple Family Poverty Correlation Chart
The statistical analysis conducted on geographies consisting of 85,614,682 people shows a substantial positive correlation between the proportion of Dutch West Indians and poverty level among married-couple families in the United States with a correlation coefficient (R) of 0.546 and weighted average of 6.4%. On average, for every 1% (one percent) increase in Dutch West Indians within a typical geography, there is an increase of 0.65% in poverty level among married-couple families.
It is essential to understand that the correlation between the percentage of Dutch West Indians and poverty level among married-couple families does not imply a direct cause-and-effect relationship. It remains uncertain whether the presence of Dutch West Indians influences an upward or downward trend in the level of poverty level among married-couple families within an area, or if Dutch West Indians simply ended up residing in those areas with higher or lower levels of poverty level among married-couple families due to other factors.
Demographics Similar to Dutch West Indians by Married-Couple Family Poverty
In terms of married-couple family poverty, the demographic groups most similar to Dutch West Indians are Ute (6.4%, a difference of 0.12%), Mexican American Indian (6.4%, a difference of 0.50%), Seminole (6.4%, a difference of 0.50%), Black/African American (6.5%, a difference of 0.51%), and Guyanese (6.5%, a difference of 0.61%).
| Demographics | Rating | Rank | Married-Couple Family Poverty |
| Indonesians | 0.1 /100 | #277 | Tragic 6.3% |
| Immigrants from Trinidad and Tobago | 0.1 /100 | #278 | Tragic 6.4% |
| Houma | 0.0 /100 | #279 | Tragic 6.4% |
| West Indians | 0.0 /100 | #280 | Tragic 6.4% |
| Mexican American Indians | 0.0 /100 | #281 | Tragic 6.4% |
| Seminole | 0.0 /100 | #282 | Tragic 6.4% |
| Ute | 0.0 /100 | #283 | Tragic 6.4% |
| Dutch West Indians | 0.0 /100 | #284 | Tragic 6.4% |
| Blacks/African Americans | 0.0 /100 | #285 | Tragic 6.5% |
| Guyanese | 0.0 /100 | #286 | Tragic 6.5% |
| Ecuadorians | 0.0 /100 | #287 | Tragic 6.5% |
| Salvadorans | 0.0 /100 | #288 | Tragic 6.5% |
| Nepalese | 0.0 /100 | #289 | Tragic 6.5% |
| Immigrants from Barbados | 0.0 /100 | #290 | Tragic 6.5% |
| Belizeans | 0.0 /100 | #291 | Tragic 6.5% |
Dutch West Indian Married-Couple Family Poverty Correlation Summary
| Measurement | Dutch West Indian Data | Married-Couple Family Poverty Data |
| Minimum | 0.033% | 3.6% |
| Maximum | 21.3% | 25.0% |
| Range | 21.3% | 21.4% |
| Mean | 5.9% | 9.2% |
| Median | 4.7% | 6.7% |
| Interquartile 25% (IQ1) | 2.3% | 5.6% |
| Interquartile 75% (IQ3) | 7.9% | 9.6% |
| Interquartile Range (IQR) | 5.6% | 4.0% |
| Standard Deviation (Sample) | 5.0% | 6.0% |
| Standard Deviation (Population) | 4.9% | 5.9% |
Correlation Details
| Dutch West Indian Percentile | Sample Size | Married-Couple Family Poverty |
[ 0.0% - 0.5% ] 0.033% | 82,876,640 | 6.2% |
[ 0.0% - 0.5% ] 0.42% | 1,783,489 | 6.1% |
[ 0.5% - 1.0% ] 0.74% | 486,805 | 6.7% |
[ 1.0% - 1.5% ] 1.05% | 185,816 | 6.9% |
[ 1.0% - 1.5% ] 1.34% | 93,881 | 8.6% |
[ 1.5% - 2.0% ] 1.68% | 60,286 | 8.3% |
[ 2.0% - 2.5% ] 2.00% | 42,960 | 9.6% |
[ 2.0% - 2.5% ] 2.29% | 11,911 | 5.4% |
[ 2.5% - 3.0% ] 2.59% | 27,014 | 6.5% |
[ 2.5% - 3.0% ] 2.95% | 12,225 | 7.1% |
[ 3.0% - 3.5% ] 3.26% | 8,870 | 10.2% |
[ 3.5% - 4.0% ] 3.57% | 6,115 | 5.8% |
[ 3.5% - 4.0% ] 3.80% | 2,710 | 6.7% |
[ 4.0% - 4.5% ] 4.07% | 6,616 | 5.3% |
[ 4.5% - 5.0% ] 4.54% | 926 | 14.1% |
[ 4.5% - 5.0% ] 4.87% | 1,150 | 6.1% |
[ 5.5% - 6.0% ] 5.51% | 254 | 3.6% |
[ 5.5% - 6.0% ] 5.75% | 1,462 | 6.7% |
[ 5.5% - 6.0% ] 5.99% | 501 | 19.4% |
[ 6.0% - 6.5% ] 6.18% | 728 | 5.0% |
[ 6.5% - 7.0% ] 6.64% | 241 | 16.7% |
[ 7.5% - 8.0% ] 7.55% | 662 | 4.4% |
[ 7.5% - 8.0% ] 7.89% | 1,356 | 5.6% |
[ 8.0% - 8.5% ] 8.17% | 208 | 9.1% |
[ 8.5% - 9.0% ] 8.55% | 1,216 | 6.0% |
[ 10.5% - 11.0% ] 10.64% | 47 | 22.2% |
[ 12.5% - 13.0% ] 12.88% | 132 | 4.3% |
[ 14.0% - 14.5% ] 14.20% | 317 | 5.3% |
[ 16.0% - 16.5% ] 16.36% | 55 | 23.1% |
[ 21.0% - 21.5% ] 21.35% | 89 | 25.0% |