Immigrants from Kazakhstan Married-Couple Family Poverty
COMPARE
Immigrants from Kazakhstan
Select to Compare
Married-Couple Family Poverty
Immigrants from Kazakhstan Married-Couple Family Poverty
5.2%
POVERTY | MARRIED-COUPLE FAMILIES
45.1/ 100
METRIC RATING
177th/ 347
METRIC RANK
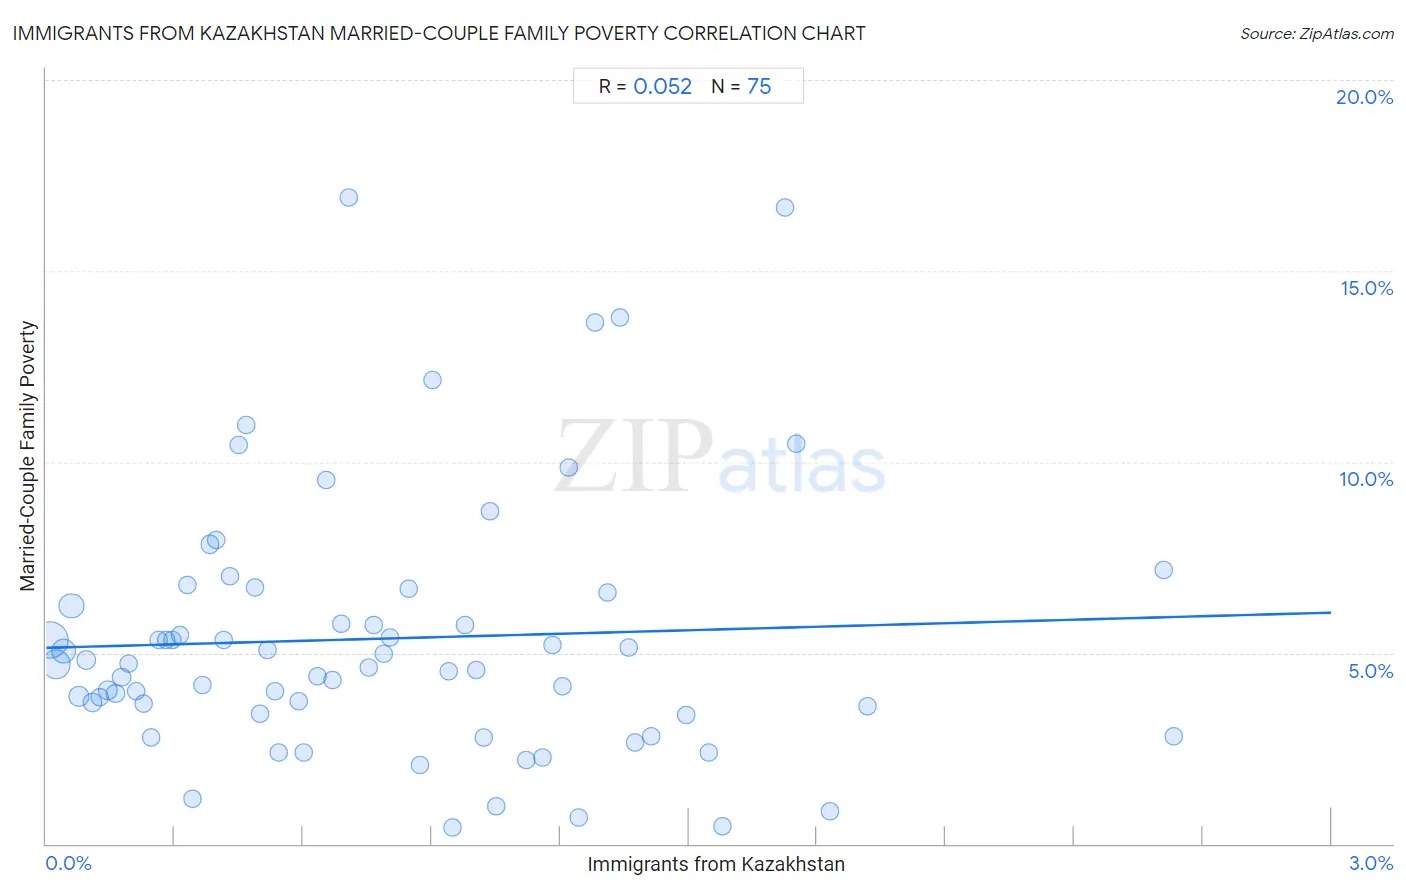
Immigrants from Kazakhstan Married-Couple Family Poverty Correlation Chart
The statistical analysis conducted on geographies consisting of 124,106,398 people shows a slight positive correlation between the proportion of Immigrants from Kazakhstan and poverty level among married-couple families in the United States with a correlation coefficient (R) of 0.052 and weighted average of 5.2%. On average, for every 1% (one percent) increase in Immigrants from Kazakhstan within a typical geography, there is an increase of 0.31% in poverty level among married-couple families.
It is essential to understand that the correlation between the percentage of Immigrants from Kazakhstan and poverty level among married-couple families does not imply a direct cause-and-effect relationship. It remains uncertain whether the presence of Immigrants from Kazakhstan influences an upward or downward trend in the level of poverty level among married-couple families within an area, or if Immigrants from Kazakhstan simply ended up residing in those areas with higher or lower levels of poverty level among married-couple families due to other factors.
Demographics Similar to Immigrants from Kazakhstan by Married-Couple Family Poverty
In terms of married-couple family poverty, the demographic groups most similar to Immigrants from Kazakhstan are Immigrants from Ukraine (5.2%, a difference of 0.020%), Menominee (5.2%, a difference of 0.32%), Marshallese (5.2%, a difference of 0.33%), Spanish (5.3%, a difference of 0.44%), and Immigrants from Eastern Africa (5.2%, a difference of 0.57%).
| Demographics | Rating | Rank | Married-Couple Family Poverty |
| Immigrants from Argentina | 54.4 /100 | #170 | Average 5.2% |
| Bermudans | 52.9 /100 | #171 | Average 5.2% |
| Immigrants from Northern Africa | 51.3 /100 | #172 | Average 5.2% |
| Alsatians | 51.2 /100 | #173 | Average 5.2% |
| Immigrants from Eastern Africa | 50.0 /100 | #174 | Average 5.2% |
| Marshallese | 47.9 /100 | #175 | Average 5.2% |
| Menominee | 47.8 /100 | #176 | Average 5.2% |
| Immigrants from Kazakhstan | 45.1 /100 | #177 | Average 5.2% |
| Immigrants from Ukraine | 44.9 /100 | #178 | Average 5.2% |
| Spanish | 41.4 /100 | #179 | Average 5.3% |
| Immigrants from Sierra Leone | 39.3 /100 | #180 | Fair 5.3% |
| Immigrants from Chile | 38.8 /100 | #181 | Fair 5.3% |
| Immigrants from Vietnam | 37.7 /100 | #182 | Fair 5.3% |
| Peruvians | 37.6 /100 | #183 | Fair 5.3% |
| Nonimmigrants | 35.8 /100 | #184 | Fair 5.3% |
Immigrants from Kazakhstan Married-Couple Family Poverty Correlation Summary
| Measurement | Immigrants from Kazakhstan Data | Married-Couple Family Poverty Data |
| Minimum | 0.0085% | 0.43% |
| Maximum | 2.6% | 16.9% |
| Range | 2.6% | 16.5% |
| Mean | 0.78% | 5.4% |
| Median | 0.67% | 4.7% |
| Interquartile 25% (IQ1) | 0.31% | 3.4% |
| Interquartile 75% (IQ3) | 1.2% | 6.6% |
| Interquartile Range (IQR) | 0.87% | 3.2% |
| Standard Deviation (Sample) | 0.59% | 3.4% |
| Standard Deviation (Population) | 0.58% | 3.4% |
Correlation Details
| Immigrants from Kazakhstan Percentile | Sample Size | Married-Couple Family Poverty |
[ 0.0% - 0.5% ] 0.0085% | 44,549,186 | 5.3% |
[ 0.0% - 0.5% ] 0.024% | 24,146,891 | 4.7% |
[ 0.0% - 0.5% ] 0.041% | 15,554,554 | 5.0% |
[ 0.0% - 0.5% ] 0.058% | 16,738,616 | 6.2% |
[ 0.0% - 0.5% ] 0.075% | 5,367,955 | 3.9% |
[ 0.0% - 0.5% ] 0.093% | 2,909,809 | 4.8% |
[ 0.0% - 0.5% ] 0.11% | 3,215,355 | 3.7% |
[ 0.0% - 0.5% ] 0.13% | 1,515,292 | 3.8% |
[ 0.0% - 0.5% ] 0.14% | 1,522,347 | 4.0% |
[ 0.0% - 0.5% ] 0.16% | 1,022,316 | 3.9% |
[ 0.0% - 0.5% ] 0.18% | 1,467,383 | 4.4% |
[ 0.0% - 0.5% ] 0.19% | 666,088 | 4.7% |
[ 0.0% - 0.5% ] 0.21% | 510,652 | 4.0% |
[ 0.0% - 0.5% ] 0.23% | 580,505 | 3.7% |
[ 0.0% - 0.5% ] 0.24% | 422,491 | 2.8% |
[ 0.0% - 0.5% ] 0.26% | 407,353 | 5.3% |
[ 0.0% - 0.5% ] 0.28% | 360,770 | 5.3% |
[ 0.0% - 0.5% ] 0.29% | 304,675 | 5.3% |
[ 0.0% - 0.5% ] 0.31% | 230,113 | 5.5% |
[ 0.0% - 0.5% ] 0.33% | 359,152 | 6.8% |
[ 0.0% - 0.5% ] 0.34% | 29,693 | 1.2% |
[ 0.0% - 0.5% ] 0.36% | 119,589 | 4.2% |
[ 0.0% - 0.5% ] 0.38% | 233,312 | 7.8% |
[ 0.0% - 0.5% ] 0.40% | 213,842 | 8.0% |
[ 0.0% - 0.5% ] 0.41% | 158,717 | 5.3% |
[ 0.0% - 0.5% ] 0.43% | 176,461 | 7.0% |
[ 0.0% - 0.5% ] 0.45% | 161,797 | 10.4% |
[ 0.0% - 0.5% ] 0.47% | 103,054 | 11.0% |
[ 0.0% - 0.5% ] 0.49% | 127,670 | 6.7% |
[ 0.0% - 0.5% ] 0.50% | 21,892 | 3.4% |
[ 0.5% - 1.0% ] 0.52% | 28,846 | 5.1% |
[ 0.5% - 1.0% ] 0.53% | 46,516 | 4.0% |
[ 0.5% - 1.0% ] 0.54% | 56,767 | 2.4% |
[ 0.5% - 1.0% ] 0.59% | 63,599 | 3.7% |
[ 0.5% - 1.0% ] 0.60% | 6,664 | 2.4% |
[ 0.5% - 1.0% ] 0.63% | 60,252 | 4.4% |
[ 0.5% - 1.0% ] 0.65% | 134,010 | 9.5% |
[ 0.5% - 1.0% ] 0.67% | 11,846 | 4.3% |
[ 0.5% - 1.0% ] 0.69% | 46,489 | 5.8% |
[ 0.5% - 1.0% ] 0.71% | 3,827 | 16.9% |
[ 0.5% - 1.0% ] 0.75% | 6,098 | 4.6% |
[ 0.5% - 1.0% ] 0.76% | 20,929 | 5.7% |
[ 0.5% - 1.0% ] 0.79% | 16,013 | 5.0% |
[ 0.5% - 1.0% ] 0.80% | 29,673 | 5.4% |
[ 0.5% - 1.0% ] 0.85% | 4,602 | 6.7% |
[ 0.5% - 1.0% ] 0.87% | 1,946 | 2.1% |
[ 0.5% - 1.0% ] 0.90% | 83,069 | 12.1% |
[ 0.5% - 1.0% ] 0.94% | 20,632 | 4.5% |
[ 0.5% - 1.0% ] 0.95% | 6,952 | 0.43% |
[ 0.5% - 1.0% ] 0.98% | 41,667 | 5.7% |
[ 1.0% - 1.5% ] 1.01% | 199 | 4.5% |
[ 1.0% - 1.5% ] 1.02% | 25,040 | 2.8% |
[ 1.0% - 1.5% ] 1.04% | 14,291 | 8.7% |
[ 1.0% - 1.5% ] 1.05% | 9,696 | 0.98% |
[ 1.0% - 1.5% ] 1.12% | 12,863 | 2.2% |
[ 1.0% - 1.5% ] 1.16% | 691 | 2.2% |
[ 1.0% - 1.5% ] 1.18% | 6,592 | 5.2% |
[ 1.0% - 1.5% ] 1.20% | 13,778 | 4.1% |
[ 1.0% - 1.5% ] 1.22% | 6,648 | 9.8% |
[ 1.0% - 1.5% ] 1.24% | 6,914 | 0.69% |
[ 1.0% - 1.5% ] 1.28% | 38,430 | 13.6% |
[ 1.0% - 1.5% ] 1.31% | 611 | 6.6% |
[ 1.0% - 1.5% ] 1.34% | 597 | 13.8% |
[ 1.0% - 1.5% ] 1.36% | 8,962 | 5.1% |
[ 1.0% - 1.5% ] 1.38% | 5,162 | 2.7% |
[ 1.0% - 1.5% ] 1.41% | 8,065 | 2.8% |
[ 1.0% - 1.5% ] 1.49% | 3,014 | 3.4% |
[ 1.5% - 2.0% ] 1.55% | 3,424 | 2.4% |
[ 1.5% - 2.0% ] 1.58% | 25,729 | 0.45% |
[ 1.5% - 2.0% ] 1.72% | 116 | 16.7% |
[ 1.5% - 2.0% ] 1.75% | 15,130 | 10.5% |
[ 1.5% - 2.0% ] 1.83% | 3,224 | 0.86% |
[ 1.5% - 2.0% ] 1.92% | 417 | 3.6% |
[ 2.5% - 3.0% ] 2.61% | 7,662 | 7.2% |
[ 2.5% - 3.0% ] 2.63% | 1,216 | 2.8% |