Immigrants from Colombia Married-Couple Family Poverty
COMPARE
Immigrants from Colombia
Select to Compare
Married-Couple Family Poverty
Immigrants from Colombia Married-Couple Family Poverty
5.7%
POVERTY | MARRIED-COUPLE FAMILIES
3.7/ 100
METRIC RATING
233rd/ 347
METRIC RANK
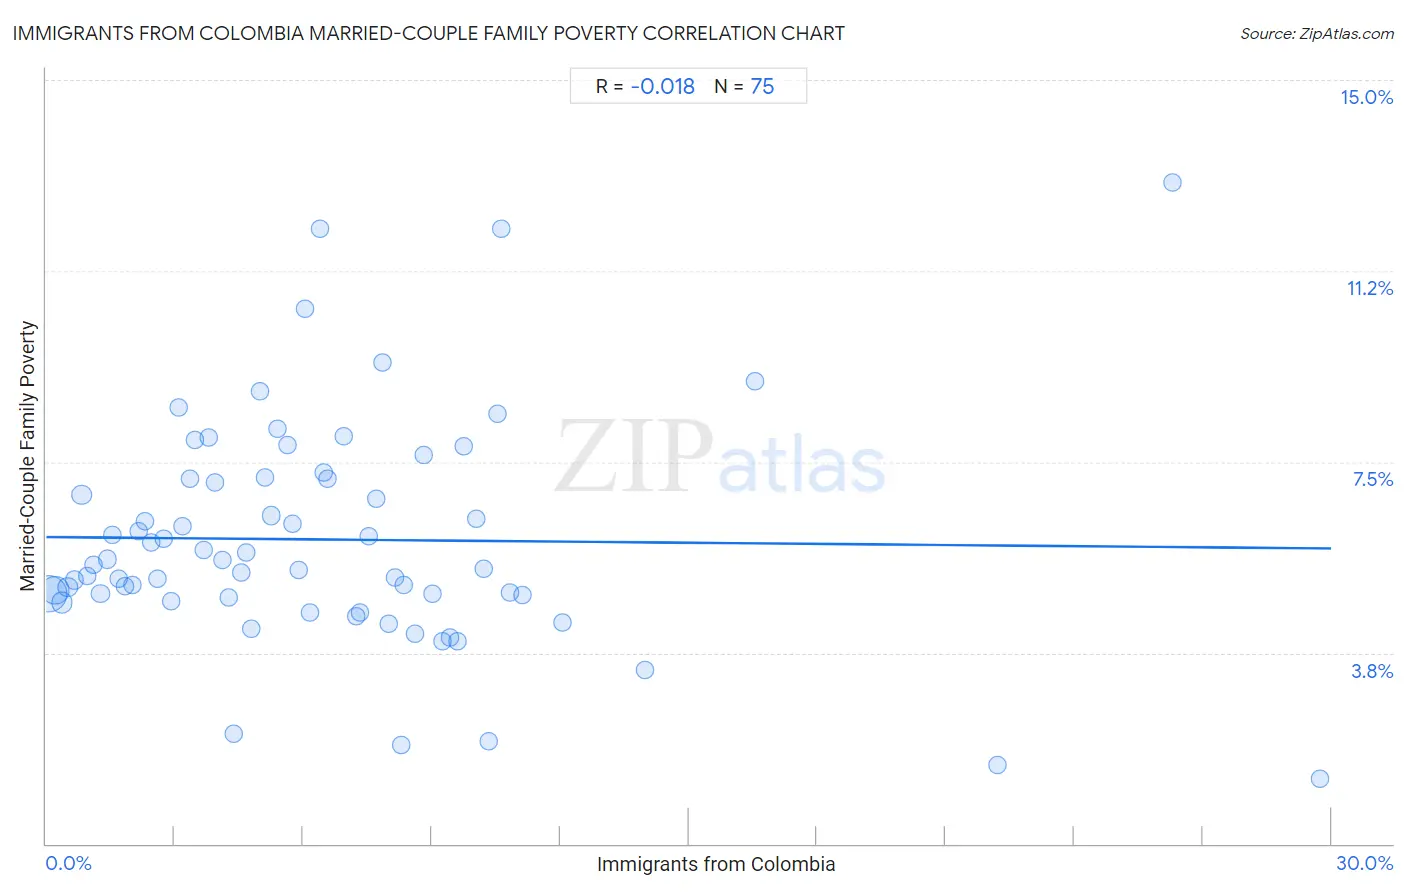
Immigrants from Colombia Married-Couple Family Poverty Correlation Chart
The statistical analysis conducted on geographies consisting of 375,670,549 people shows no correlation between the proportion of Immigrants from Colombia and poverty level among married-couple families in the United States with a correlation coefficient (R) of -0.018 and weighted average of 5.7%. On average, for every 1% (one percent) increase in Immigrants from Colombia within a typical geography, there is a decrease of 0.0075% in poverty level among married-couple families.
It is essential to understand that the correlation between the percentage of Immigrants from Colombia and poverty level among married-couple families does not imply a direct cause-and-effect relationship. It remains uncertain whether the presence of Immigrants from Colombia influences an upward or downward trend in the level of poverty level among married-couple families within an area, or if Immigrants from Colombia simply ended up residing in those areas with higher or lower levels of poverty level among married-couple families due to other factors.
Demographics Similar to Immigrants from Colombia by Married-Couple Family Poverty
In terms of married-couple family poverty, the demographic groups most similar to Immigrants from Colombia are Immigrants from Uruguay (5.7%, a difference of 0.010%), Immigrants from Sudan (5.7%, a difference of 0.19%), Ghanaian (5.7%, a difference of 0.35%), Immigrants from Laos (5.7%, a difference of 0.44%), and Immigrants from Iraq (5.7%, a difference of 0.49%).
| Demographics | Rating | Rank | Married-Couple Family Poverty |
| South Americans | 5.7 /100 | #226 | Tragic 5.6% |
| Immigrants from Zaire | 5.6 /100 | #227 | Tragic 5.6% |
| Arabs | 5.4 /100 | #228 | Tragic 5.7% |
| Sub-Saharan Africans | 4.9 /100 | #229 | Tragic 5.7% |
| Moroccans | 4.9 /100 | #230 | Tragic 5.7% |
| Immigrants from Iraq | 4.4 /100 | #231 | Tragic 5.7% |
| Immigrants from Laos | 4.4 /100 | #232 | Tragic 5.7% |
| Immigrants from Colombia | 3.7 /100 | #233 | Tragic 5.7% |
| Immigrants from Uruguay | 3.7 /100 | #234 | Tragic 5.7% |
| Immigrants from Sudan | 3.5 /100 | #235 | Tragic 5.7% |
| Ghanaians | 3.3 /100 | #236 | Tragic 5.7% |
| Immigrants from South America | 3.1 /100 | #237 | Tragic 5.7% |
| Cherokee | 2.7 /100 | #238 | Tragic 5.8% |
| Venezuelans | 2.7 /100 | #239 | Tragic 5.8% |
| Fijians | 2.5 /100 | #240 | Tragic 5.8% |
Immigrants from Colombia Married-Couple Family Poverty Correlation Summary
| Measurement | Immigrants from Colombia Data | Married-Couple Family Poverty Data |
| Minimum | 0.069% | 1.3% |
| Maximum | 29.7% | 13.0% |
| Range | 29.7% | 11.7% |
| Mean | 6.5% | 6.0% |
| Median | 5.6% | 5.5% |
| Interquartile 25% (IQ1) | 2.8% | 4.8% |
| Interquartile 75% (IQ3) | 8.8% | 7.2% |
| Interquartile Range (IQR) | 6.1% | 2.3% |
| Standard Deviation (Sample) | 5.4% | 2.2% |
| Standard Deviation (Population) | 5.4% | 2.2% |
Correlation Details
| Immigrants from Colombia Percentile | Sample Size | Married-Couple Family Poverty |
[ 0.0% - 0.5% ] 0.069% | 175,074,475 | 4.9% |
[ 0.0% - 0.5% ] 0.21% | 88,787,091 | 5.0% |
[ 0.0% - 0.5% ] 0.37% | 33,206,587 | 4.7% |
[ 0.5% - 1.0% ] 0.51% | 18,538,987 | 5.0% |
[ 0.5% - 1.0% ] 0.66% | 10,294,218 | 5.2% |
[ 0.5% - 1.0% ] 0.83% | 15,473,099 | 6.8% |
[ 0.5% - 1.0% ] 0.96% | 4,760,118 | 5.3% |
[ 1.0% - 1.5% ] 1.11% | 4,289,338 | 5.5% |
[ 1.0% - 1.5% ] 1.26% | 2,900,523 | 4.9% |
[ 1.0% - 1.5% ] 1.42% | 2,327,785 | 5.6% |
[ 1.5% - 2.0% ] 1.55% | 2,064,103 | 6.1% |
[ 1.5% - 2.0% ] 1.70% | 1,590,289 | 5.2% |
[ 1.5% - 2.0% ] 1.84% | 1,337,206 | 5.1% |
[ 2.0% - 2.5% ] 2.01% | 966,721 | 5.1% |
[ 2.0% - 2.5% ] 2.16% | 1,397,929 | 6.1% |
[ 2.0% - 2.5% ] 2.30% | 594,223 | 6.3% |
[ 2.0% - 2.5% ] 2.44% | 697,407 | 5.9% |
[ 2.5% - 3.0% ] 2.60% | 669,621 | 5.2% |
[ 2.5% - 3.0% ] 2.75% | 692,712 | 6.0% |
[ 2.5% - 3.0% ] 2.91% | 756,667 | 4.8% |
[ 3.0% - 3.5% ] 3.08% | 1,033,000 | 8.6% |
[ 3.0% - 3.5% ] 3.17% | 524,341 | 6.2% |
[ 3.0% - 3.5% ] 3.34% | 444,255 | 7.2% |
[ 3.0% - 3.5% ] 3.47% | 804,095 | 7.9% |
[ 3.5% - 4.0% ] 3.67% | 477,997 | 5.8% |
[ 3.5% - 4.0% ] 3.80% | 516,977 | 8.0% |
[ 3.5% - 4.0% ] 3.95% | 621,177 | 7.1% |
[ 4.0% - 4.5% ] 4.12% | 388,150 | 5.6% |
[ 4.0% - 4.5% ] 4.25% | 323,415 | 4.8% |
[ 4.0% - 4.5% ] 4.39% | 113,806 | 2.2% |
[ 4.5% - 5.0% ] 4.56% | 178,344 | 5.3% |
[ 4.5% - 5.0% ] 4.66% | 272,359 | 5.7% |
[ 4.5% - 5.0% ] 4.78% | 91,989 | 4.2% |
[ 4.5% - 5.0% ] 4.98% | 167,630 | 8.9% |
[ 5.0% - 5.5% ] 5.11% | 430,423 | 7.2% |
[ 5.0% - 5.5% ] 5.25% | 331,239 | 6.4% |
[ 5.0% - 5.5% ] 5.40% | 95,759 | 8.2% |
[ 5.5% - 6.0% ] 5.63% | 70,197 | 7.8% |
[ 5.5% - 6.0% ] 5.74% | 40,707 | 6.3% |
[ 5.5% - 6.0% ] 5.89% | 258,003 | 5.4% |
[ 6.0% - 6.5% ] 6.03% | 131,861 | 10.5% |
[ 6.0% - 6.5% ] 6.16% | 109,673 | 4.5% |
[ 6.0% - 6.5% ] 6.38% | 44,893 | 12.1% |
[ 6.0% - 6.5% ] 6.48% | 126,100 | 7.3% |
[ 6.5% - 7.0% ] 6.57% | 98,113 | 7.2% |
[ 6.5% - 7.0% ] 6.94% | 66,333 | 8.0% |
[ 7.0% - 7.5% ] 7.25% | 35,967 | 4.5% |
[ 7.0% - 7.5% ] 7.32% | 32,520 | 4.5% |
[ 7.5% - 8.0% ] 7.52% | 85,062 | 6.0% |
[ 7.5% - 8.0% ] 7.71% | 135,665 | 6.8% |
[ 7.5% - 8.0% ] 7.84% | 34,809 | 9.4% |
[ 7.5% - 8.0% ] 7.98% | 67,213 | 4.3% |
[ 8.0% - 8.5% ] 8.13% | 68,157 | 5.2% |
[ 8.0% - 8.5% ] 8.28% | 27,837 | 1.9% |
[ 8.0% - 8.5% ] 8.34% | 121,169 | 5.1% |
[ 8.5% - 9.0% ] 8.61% | 50,017 | 4.1% |
[ 8.5% - 9.0% ] 8.82% | 150,087 | 7.6% |
[ 9.0% - 9.5% ] 9.02% | 110,087 | 4.9% |
[ 9.0% - 9.5% ] 9.26% | 57,557 | 4.0% |
[ 9.0% - 9.5% ] 9.42% | 42,207 | 4.0% |
[ 9.5% - 10.0% ] 9.60% | 39,141 | 4.0% |
[ 9.5% - 10.0% ] 9.74% | 115,726 | 7.8% |
[ 10.0% - 10.5% ] 10.04% | 109,774 | 6.4% |
[ 10.0% - 10.5% ] 10.21% | 58,094 | 5.4% |
[ 10.0% - 10.5% ] 10.34% | 6,202 | 2.0% |
[ 10.5% - 11.0% ] 10.54% | 16,450 | 8.4% |
[ 10.5% - 11.0% ] 10.63% | 15,622 | 12.1% |
[ 10.5% - 11.0% ] 10.84% | 45,357 | 4.9% |
[ 11.0% - 11.5% ] 11.11% | 18,426 | 4.9% |
[ 12.0% - 12.5% ] 12.05% | 31,514 | 4.4% |
[ 13.5% - 14.0% ] 13.98% | 11,069 | 3.4% |
[ 16.5% - 17.0% ] 16.54% | 133 | 9.1% |
[ 22.0% - 22.5% ] 22.22% | 180 | 1.5% |
[ 26.0% - 26.5% ] 26.29% | 1,761 | 13.0% |
[ 29.5% - 30.0% ] 29.74% | 2,811 | 1.3% |