Immigrants from Asia Married-Couple Family Poverty
COMPARE
Immigrants from Asia
Select to Compare
Married-Couple Family Poverty
Immigrants from Asia Married-Couple Family Poverty
4.8%
POVERTY | MARRIED-COUPLE FAMILIES
92.3/ 100
METRIC RATING
126th/ 347
METRIC RANK
Immigrants from Asia Married-Couple Family Poverty Correlation Chart
The statistical analysis conducted on geographies consisting of 538,014,921 people shows a weak positive correlation between the proportion of Immigrants from Asia and poverty level among married-couple families in the United States with a correlation coefficient (R) of 0.291 and weighted average of 4.8%. On average, for every 1% (one percent) increase in Immigrants from Asia within a typical geography, there is an increase of 0.043% in poverty level among married-couple families.
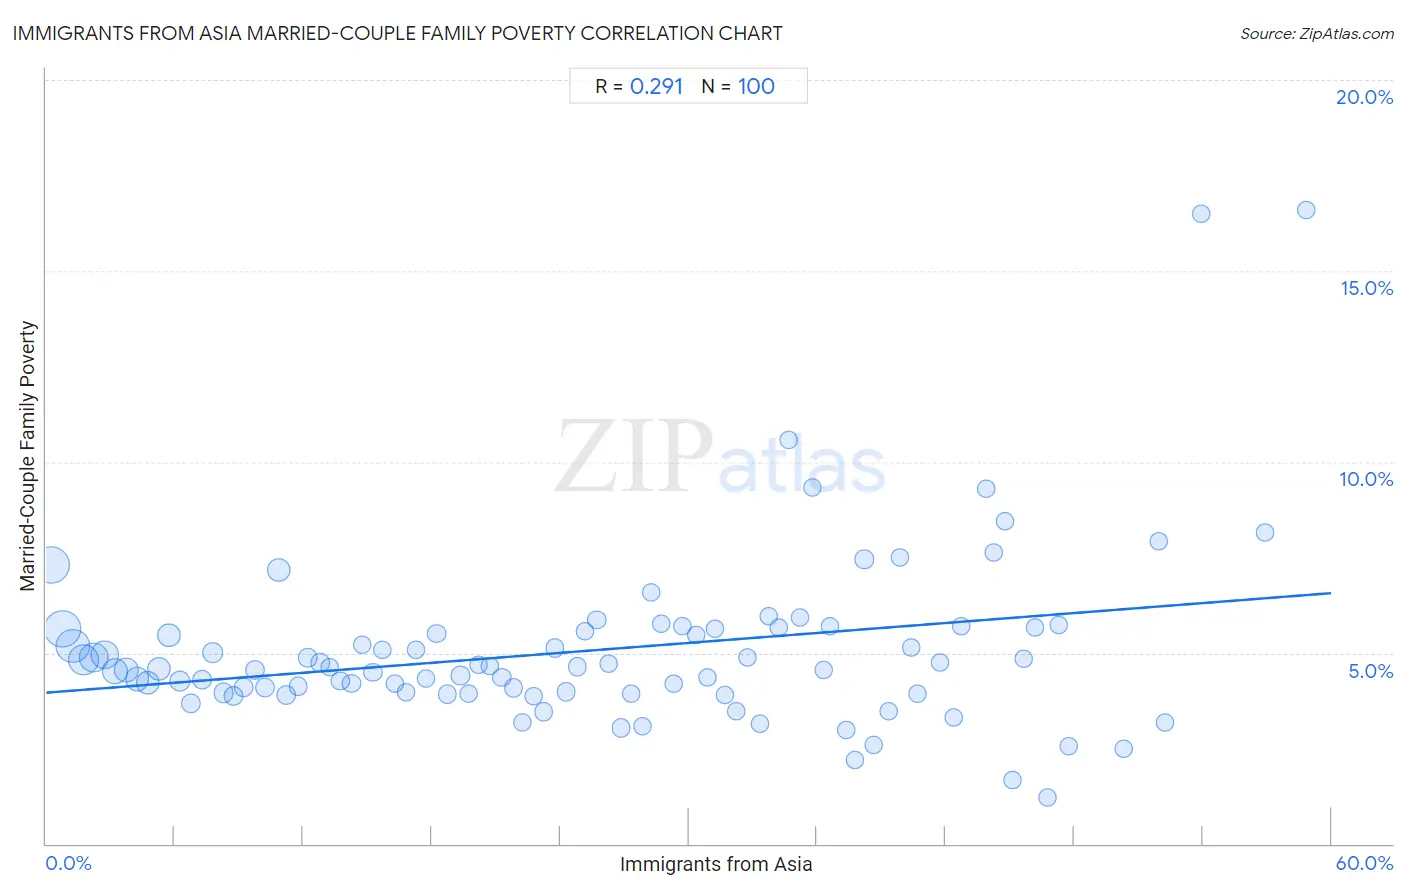
It is essential to understand that the correlation between the percentage of Immigrants from Asia and poverty level among married-couple families does not imply a direct cause-and-effect relationship. It remains uncertain whether the presence of Immigrants from Asia influences an upward or downward trend in the level of poverty level among married-couple families within an area, or if Immigrants from Asia simply ended up residing in those areas with higher or lower levels of poverty level among married-couple families due to other factors.
Demographics Similar to Immigrants from Asia by Married-Couple Family Poverty
In terms of married-couple family poverty, the demographic groups most similar to Immigrants from Asia are Immigrants from Bosnia and Herzegovina (4.8%, a difference of 0.070%), Romanian (4.8%, a difference of 0.090%), Egyptian (4.8%, a difference of 0.14%), Jordanian (4.8%, a difference of 0.36%), and White/Caucasian (4.8%, a difference of 0.37%).
| Demographics | Rating | Rank | Married-Couple Family Poverty |
| Immigrants from Eastern Asia | 94.0 /100 | #119 | Exceptional 4.8% |
| Immigrants from Southern Europe | 93.4 /100 | #120 | Exceptional 4.8% |
| Indians (Asian) | 93.2 /100 | #121 | Exceptional 4.8% |
| Whites/Caucasians | 93.1 /100 | #122 | Exceptional 4.8% |
| Jordanians | 93.1 /100 | #123 | Exceptional 4.8% |
| Romanians | 92.5 /100 | #124 | Exceptional 4.8% |
| Immigrants from Bosnia and Herzegovina | 92.5 /100 | #125 | Exceptional 4.8% |
| Immigrants from Asia | 92.3 /100 | #126 | Exceptional 4.8% |
| Egyptians | 92.0 /100 | #127 | Exceptional 4.8% |
| Palestinians | 91.2 /100 | #128 | Exceptional 4.9% |
| Immigrants from Pakistan | 90.7 /100 | #129 | Exceptional 4.9% |
| Soviet Union | 90.7 /100 | #130 | Exceptional 4.9% |
| Immigrants from Eastern Europe | 90.5 /100 | #131 | Exceptional 4.9% |
| Puget Sound Salish | 90.4 /100 | #132 | Exceptional 4.9% |
| Immigrants from Kenya | 90.2 /100 | #133 | Exceptional 4.9% |
Immigrants from Asia Married-Couple Family Poverty Correlation Summary
| Measurement | Immigrants from Asia Data | Married-Couple Family Poverty Data |
| Minimum | 0.26% | 1.2% |
| Maximum | 58.8% | 16.6% |
| Range | 58.6% | 15.4% |
| Mean | 25.4% | 5.1% |
| Median | 25.0% | 4.6% |
| Interquartile 25% (IQ1) | 12.5% | 3.9% |
| Interquartile 75% (IQ3) | 37.6% | 5.6% |
| Interquartile Range (IQR) | 25.1% | 1.7% |
| Standard Deviation (Sample) | 15.2% | 2.3% |
| Standard Deviation (Population) | 15.2% | 2.3% |
Correlation Details
| Immigrants from Asia Percentile | Sample Size | Married-Couple Family Poverty |
[ 0.0% - 0.5% ] 0.26% | 63,716,323 | 7.3% |
[ 0.5% - 1.0% ] 0.74% | 62,914,561 | 5.6% |
[ 1.0% - 1.5% ] 1.24% | 52,819,317 | 5.2% |
[ 1.5% - 2.0% ] 1.74% | 43,950,193 | 4.8% |
[ 2.0% - 2.5% ] 2.24% | 38,169,125 | 4.9% |
[ 2.5% - 3.0% ] 2.73% | 35,565,425 | 4.9% |
[ 3.0% - 3.5% ] 3.23% | 25,681,344 | 4.5% |
[ 3.5% - 4.0% ] 3.75% | 20,864,280 | 4.5% |
[ 4.0% - 4.5% ] 4.25% | 18,762,208 | 4.3% |
[ 4.5% - 5.0% ] 4.75% | 15,522,541 | 4.2% |
[ 5.0% - 5.5% ] 5.24% | 16,078,664 | 4.6% |
[ 5.5% - 6.0% ] 5.74% | 15,399,538 | 5.5% |
[ 6.0% - 6.5% ] 6.25% | 9,337,301 | 4.3% |
[ 6.5% - 7.0% ] 6.75% | 6,732,376 | 3.7% |
[ 7.0% - 7.5% ] 7.29% | 6,765,138 | 4.3% |
[ 7.5% - 8.0% ] 7.77% | 7,266,475 | 5.0% |
[ 8.0% - 8.5% ] 8.27% | 5,804,340 | 4.0% |
[ 8.5% - 9.0% ] 8.73% | 6,525,268 | 3.9% |
[ 9.0% - 9.5% ] 9.22% | 4,748,069 | 4.1% |
[ 9.5% - 10.0% ] 9.74% | 4,338,539 | 4.5% |
[ 10.0% - 10.5% ] 10.23% | 4,432,734 | 4.1% |
[ 10.5% - 11.0% ] 10.88% | 16,844,777 | 7.2% |
[ 11.0% - 11.5% ] 11.23% | 4,136,742 | 3.9% |
[ 11.5% - 12.0% ] 11.76% | 4,037,302 | 4.1% |
[ 12.0% - 12.5% ] 12.22% | 2,363,239 | 4.9% |
[ 12.5% - 13.0% ] 12.78% | 2,599,217 | 4.7% |
[ 13.0% - 13.5% ] 13.23% | 2,191,531 | 4.6% |
[ 13.5% - 14.0% ] 13.73% | 1,976,278 | 4.3% |
[ 14.0% - 14.5% ] 14.24% | 2,582,688 | 4.2% |
[ 14.5% - 15.0% ] 14.76% | 1,812,083 | 5.2% |
[ 15.0% - 15.5% ] 15.25% | 1,715,521 | 4.5% |
[ 15.5% - 16.0% ] 15.71% | 1,073,742 | 5.1% |
[ 16.0% - 16.5% ] 16.29% | 1,284,645 | 4.2% |
[ 16.5% - 17.0% ] 16.81% | 1,405,537 | 4.0% |
[ 17.0% - 17.5% ] 17.27% | 1,330,986 | 5.1% |
[ 17.5% - 18.0% ] 17.74% | 1,549,785 | 4.3% |
[ 18.0% - 18.5% ] 18.24% | 1,610,106 | 5.5% |
[ 18.5% - 19.0% ] 18.74% | 1,369,145 | 3.9% |
[ 19.0% - 19.5% ] 19.34% | 937,162 | 4.4% |
[ 19.5% - 20.0% ] 19.73% | 855,386 | 3.9% |
[ 20.0% - 20.5% ] 20.20% | 1,259,191 | 4.7% |
[ 20.5% - 21.0% ] 20.71% | 1,289,436 | 4.7% |
[ 21.0% - 21.5% ] 21.27% | 599,618 | 4.3% |
[ 21.5% - 22.0% ] 21.80% | 1,598,543 | 4.1% |
[ 22.0% - 22.5% ] 22.21% | 590,630 | 3.2% |
[ 22.5% - 23.0% ] 22.74% | 713,352 | 3.9% |
[ 23.0% - 23.5% ] 23.23% | 649,413 | 3.5% |
[ 23.5% - 24.0% ] 23.75% | 695,257 | 5.1% |
[ 24.0% - 24.5% ] 24.26% | 714,733 | 4.0% |
[ 24.5% - 25.0% ] 24.80% | 905,883 | 4.6% |
[ 25.0% - 25.5% ] 25.17% | 151,032 | 5.6% |
[ 25.5% - 26.0% ] 25.71% | 687,029 | 5.9% |
[ 26.0% - 26.5% ] 26.26% | 453,247 | 4.7% |
[ 26.5% - 27.0% ] 26.83% | 1,266,078 | 3.0% |
[ 27.0% - 27.5% ] 27.30% | 477,780 | 3.9% |
[ 27.5% - 28.0% ] 27.83% | 85,952 | 3.1% |
[ 28.0% - 28.5% ] 28.22% | 539,252 | 6.6% |
[ 28.5% - 29.0% ] 28.72% | 259,698 | 5.8% |
[ 29.0% - 29.5% ] 29.28% | 368,007 | 4.2% |
[ 29.5% - 30.0% ] 29.68% | 709,536 | 5.7% |
[ 30.0% - 30.5% ] 30.35% | 312,237 | 5.5% |
[ 30.5% - 31.0% ] 30.88% | 303,046 | 4.3% |
[ 31.0% - 31.5% ] 31.21% | 167,256 | 5.6% |
[ 31.5% - 32.0% ] 31.71% | 487,982 | 3.9% |
[ 32.0% - 32.5% ] 32.23% | 121,406 | 3.5% |
[ 32.5% - 33.0% ] 32.72% | 235,073 | 4.9% |
[ 33.0% - 33.5% ] 33.34% | 224,276 | 3.2% |
[ 33.5% - 34.0% ] 33.72% | 149,691 | 6.0% |
[ 34.0% - 34.5% ] 34.20% | 164,719 | 5.7% |
[ 34.5% - 35.0% ] 34.66% | 356,115 | 10.6% |
[ 35.0% - 35.5% ] 35.17% | 171,322 | 5.9% |
[ 35.5% - 36.0% ] 35.77% | 186,282 | 9.3% |
[ 36.0% - 36.5% ] 36.31% | 304,402 | 4.6% |
[ 36.5% - 37.0% ] 36.62% | 231,065 | 5.7% |
[ 37.0% - 37.5% ] 37.34% | 70,484 | 3.0% |
[ 37.5% - 38.0% ] 37.78% | 99,529 | 2.2% |
[ 38.0% - 38.5% ] 38.20% | 328,554 | 7.4% |
[ 38.5% - 39.0% ] 38.64% | 503,242 | 2.6% |
[ 39.0% - 39.5% ] 39.36% | 225,798 | 3.5% |
[ 39.5% - 40.0% ] 39.87% | 276,472 | 7.5% |
[ 40.0% - 40.5% ] 40.37% | 64,284 | 5.2% |
[ 40.5% - 41.0% ] 40.69% | 107,338 | 3.9% |
[ 41.5% - 42.0% ] 41.74% | 63,360 | 4.8% |
[ 42.0% - 42.5% ] 42.38% | 339,583 | 3.3% |
[ 42.5% - 43.0% ] 42.74% | 173,120 | 5.7% |
[ 43.5% - 44.0% ] 43.89% | 139,016 | 9.3% |
[ 44.0% - 44.5% ] 44.23% | 140,768 | 7.6% |
[ 44.5% - 45.0% ] 44.79% | 127,809 | 8.4% |
[ 45.0% - 45.5% ] 45.11% | 21,250 | 1.7% |
[ 45.5% - 46.0% ] 45.62% | 63,812 | 4.9% |
[ 46.0% - 46.5% ] 46.17% | 40,462 | 5.7% |
[ 46.5% - 47.0% ] 46.76% | 53,256 | 1.2% |
[ 47.0% - 47.5% ] 47.26% | 108,240 | 5.7% |
[ 47.5% - 48.0% ] 47.75% | 321,759 | 2.5% |
[ 50.0% - 50.5% ] 50.31% | 57,649 | 2.5% |
[ 51.5% - 52.0% ] 51.97% | 26,418 | 7.9% |
[ 52.0% - 52.5% ] 52.22% | 30,916 | 3.2% |
[ 53.5% - 54.0% ] 53.91% | 53,371 | 16.5% |
[ 56.5% - 57.0% ] 56.92% | 766 | 8.2% |
[ 58.5% - 59.0% ] 58.82% | 79,495 | 16.6% |