Norwegian Married-Couple Family Poverty
COMPARE
Norwegian
Select to Compare
Married-Couple Family Poverty
Norwegian Married-Couple Family Poverty
3.7%
POVERTY | MARRIED-COUPLE FAMILIES
100.0/ 100
METRIC RATING
3rd/ 347
METRIC RANK
Norwegian Married-Couple Family Poverty Correlation Chart
The statistical analysis conducted on geographies consisting of 522,229,251 people shows a mild positive correlation between the proportion of Norwegians and poverty level among married-couple families in the United States with a correlation coefficient (R) of 0.355 and weighted average of 3.7%. On average, for every 1% (one percent) increase in Norwegians within a typical geography, there is an increase of 0.13% in poverty level among married-couple families.
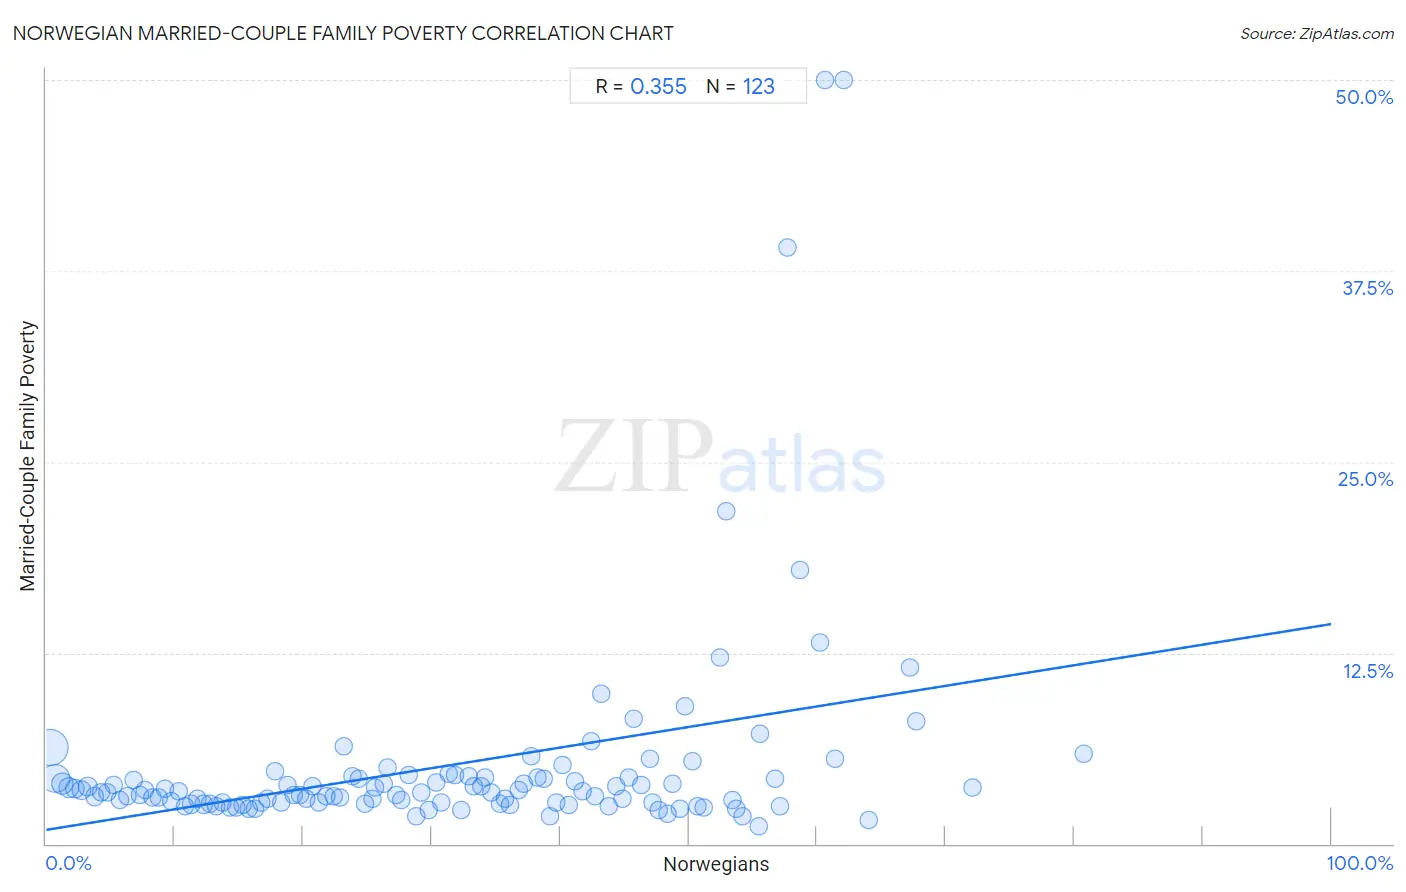
It is essential to understand that the correlation between the percentage of Norwegians and poverty level among married-couple families does not imply a direct cause-and-effect relationship. It remains uncertain whether the presence of Norwegians influences an upward or downward trend in the level of poverty level among married-couple families within an area, or if Norwegians simply ended up residing in those areas with higher or lower levels of poverty level among married-couple families due to other factors.
Demographics Similar to Norwegians by Married-Couple Family Poverty
In terms of married-couple family poverty, the demographic groups most similar to Norwegians are Chinese (3.6%, a difference of 1.9%), Immigrants from India (3.6%, a difference of 2.1%), Slovene (3.8%, a difference of 3.6%), Swedish (3.9%, a difference of 3.8%), and Luxembourger (3.9%, a difference of 4.4%).
| Demographics | Rating | Rank | Married-Couple Family Poverty |
| Immigrants from India | 100.0 /100 | #1 | Exceptional 3.6% |
| Chinese | 100.0 /100 | #2 | Exceptional 3.6% |
| Norwegians | 100.0 /100 | #3 | Exceptional 3.7% |
| Slovenes | 100.0 /100 | #4 | Exceptional 3.8% |
| Swedes | 100.0 /100 | #5 | Exceptional 3.9% |
| Luxembourgers | 100.0 /100 | #6 | Exceptional 3.9% |
| Latvians | 100.0 /100 | #7 | Exceptional 3.9% |
| Thais | 100.0 /100 | #8 | Exceptional 3.9% |
| Croatians | 100.0 /100 | #9 | Exceptional 3.9% |
| Carpatho Rusyns | 100.0 /100 | #10 | Exceptional 3.9% |
| Lithuanians | 100.0 /100 | #11 | Exceptional 4.0% |
| Bulgarians | 100.0 /100 | #12 | Exceptional 4.0% |
| Czechs | 100.0 /100 | #13 | Exceptional 4.0% |
| Slovaks | 100.0 /100 | #14 | Exceptional 4.0% |
| Poles | 100.0 /100 | #15 | Exceptional 4.0% |
Norwegian Married-Couple Family Poverty Correlation Summary
| Measurement | Norwegian Data | Married-Couple Family Poverty Data |
| Minimum | 0.25% | 1.2% |
| Maximum | 80.7% | 50.0% |
| Range | 80.4% | 48.8% |
| Mean | 31.3% | 5.1% |
| Median | 30.7% | 3.4% |
| Interquartile 25% (IQ1) | 15.2% | 2.7% |
| Interquartile 75% (IQ3) | 46.3% | 4.4% |
| Interquartile Range (IQR) | 31.1% | 1.7% |
| Standard Deviation (Sample) | 18.9% | 7.2% |
| Standard Deviation (Population) | 18.8% | 7.1% |
Correlation Details
| Norwegian Percentile | Sample Size | Married-Couple Family Poverty |
[ 0.0% - 0.5% ] 0.25% | 234,431,618 | 6.3% |
[ 0.5% - 1.0% ] 0.71% | 132,250,642 | 4.3% |
[ 1.0% - 1.5% ] 1.22% | 49,843,753 | 3.9% |
[ 1.5% - 2.0% ] 1.73% | 28,282,559 | 3.7% |
[ 2.0% - 2.5% ] 2.24% | 17,905,033 | 3.6% |
[ 2.5% - 3.0% ] 2.74% | 11,278,721 | 3.5% |
[ 3.0% - 3.5% ] 3.25% | 8,324,583 | 3.8% |
[ 3.5% - 4.0% ] 3.77% | 7,142,021 | 3.1% |
[ 4.0% - 4.5% ] 4.24% | 4,926,450 | 3.3% |
[ 4.5% - 5.0% ] 4.73% | 3,585,775 | 3.4% |
[ 5.0% - 5.5% ] 5.24% | 2,118,490 | 3.8% |
[ 5.5% - 6.0% ] 5.77% | 2,074,797 | 2.9% |
[ 6.0% - 6.5% ] 6.29% | 1,777,687 | 3.1% |
[ 6.5% - 7.0% ] 6.80% | 1,658,500 | 4.2% |
[ 7.0% - 7.5% ] 7.28% | 968,395 | 3.2% |
[ 7.5% - 8.0% ] 7.72% | 1,068,019 | 3.5% |
[ 8.0% - 8.5% ] 8.24% | 599,450 | 3.1% |
[ 8.5% - 9.0% ] 8.79% | 641,128 | 3.0% |
[ 9.0% - 9.5% ] 9.24% | 969,852 | 3.6% |
[ 9.5% - 10.0% ] 9.75% | 895,076 | 2.8% |
[ 10.0% - 10.5% ] 10.27% | 579,293 | 3.4% |
[ 10.5% - 11.0% ] 10.75% | 940,621 | 2.5% |
[ 11.0% - 11.5% ] 11.24% | 964,137 | 2.6% |
[ 11.5% - 12.0% ] 11.75% | 996,074 | 2.9% |
[ 12.0% - 12.5% ] 12.27% | 1,037,593 | 2.6% |
[ 12.5% - 13.0% ] 12.74% | 601,806 | 2.6% |
[ 13.0% - 13.5% ] 13.22% | 792,097 | 2.5% |
[ 13.5% - 14.0% ] 13.72% | 566,011 | 2.7% |
[ 14.0% - 14.5% ] 14.27% | 525,526 | 2.4% |
[ 14.5% - 15.0% ] 14.74% | 493,758 | 2.4% |
[ 15.0% - 15.5% ] 15.23% | 385,598 | 2.6% |
[ 15.5% - 16.0% ] 15.75% | 394,805 | 2.3% |
[ 16.0% - 16.5% ] 16.21% | 208,708 | 2.3% |
[ 16.5% - 17.0% ] 16.72% | 341,722 | 2.7% |
[ 17.0% - 17.5% ] 17.19% | 193,846 | 3.0% |
[ 17.5% - 18.0% ] 17.79% | 149,369 | 4.7% |
[ 18.0% - 18.5% ] 18.26% | 150,144 | 2.7% |
[ 18.5% - 19.0% ] 18.74% | 85,233 | 3.8% |
[ 19.0% - 19.5% ] 19.22% | 82,033 | 3.2% |
[ 19.5% - 20.0% ] 19.74% | 73,559 | 3.2% |
[ 20.0% - 20.5% ] 20.23% | 163,201 | 3.0% |
[ 20.5% - 21.0% ] 20.73% | 49,269 | 3.8% |
[ 21.0% - 21.5% ] 21.24% | 97,753 | 2.7% |
[ 21.5% - 22.0% ] 21.74% | 64,609 | 3.1% |
[ 22.0% - 22.5% ] 22.35% | 69,032 | 3.1% |
[ 22.5% - 23.0% ] 22.82% | 82,882 | 3.0% |
[ 23.0% - 23.5% ] 23.20% | 34,212 | 6.4% |
[ 23.5% - 24.0% ] 23.86% | 83,554 | 4.4% |
[ 24.0% - 24.5% ] 24.27% | 22,517 | 4.3% |
[ 24.5% - 25.0% ] 24.84% | 52,424 | 2.6% |
[ 25.0% - 25.5% ] 25.36% | 43,389 | 3.0% |
[ 25.5% - 26.0% ] 25.62% | 203,488 | 3.7% |
[ 26.0% - 26.5% ] 26.22% | 136,126 | 4.0% |
[ 26.5% - 27.0% ] 26.60% | 41,739 | 5.0% |
[ 27.0% - 27.5% ] 27.20% | 151,979 | 3.2% |
[ 27.5% - 28.0% ] 27.63% | 65,926 | 2.9% |
[ 28.0% - 28.5% ] 28.22% | 14,706 | 4.5% |
[ 28.5% - 29.0% ] 28.80% | 99,120 | 1.8% |
[ 29.0% - 29.5% ] 29.20% | 42,813 | 3.3% |
[ 29.5% - 30.0% ] 29.73% | 31,277 | 2.2% |
[ 30.0% - 30.5% ] 30.31% | 28,368 | 4.0% |
[ 30.5% - 31.0% ] 30.69% | 12,212 | 2.7% |
[ 31.0% - 31.5% ] 31.37% | 14,699 | 4.6% |
[ 31.5% - 32.0% ] 31.79% | 11,352 | 4.5% |
[ 32.0% - 32.5% ] 32.28% | 8,852 | 2.2% |
[ 32.5% - 33.0% ] 32.86% | 31,161 | 4.4% |
[ 33.0% - 33.5% ] 33.26% | 31,218 | 3.7% |
[ 33.5% - 34.0% ] 33.81% | 7,089 | 3.7% |
[ 34.0% - 34.5% ] 34.14% | 15,891 | 4.3% |
[ 34.5% - 35.0% ] 34.66% | 10,380 | 3.4% |
[ 35.0% - 35.5% ] 35.29% | 14,842 | 2.6% |
[ 35.5% - 36.0% ] 35.74% | 18,005 | 2.9% |
[ 36.0% - 36.5% ] 36.10% | 31,896 | 2.6% |
[ 36.5% - 37.0% ] 36.77% | 12,982 | 3.5% |
[ 37.0% - 37.5% ] 37.15% | 4,511 | 3.9% |
[ 37.5% - 38.0% ] 37.70% | 10,318 | 5.7% |
[ 38.0% - 38.5% ] 38.22% | 7,067 | 4.4% |
[ 38.5% - 39.0% ] 38.73% | 9,760 | 4.2% |
[ 39.0% - 39.5% ] 39.20% | 4,842 | 1.8% |
[ 39.5% - 40.0% ] 39.68% | 5,458 | 2.7% |
[ 40.0% - 40.5% ] 40.20% | 4,037 | 5.2% |
[ 40.5% - 41.0% ] 40.71% | 5,225 | 2.5% |
[ 41.0% - 41.5% ] 41.18% | 5,692 | 4.1% |
[ 41.5% - 42.0% ] 41.70% | 4,048 | 3.4% |
[ 42.0% - 42.5% ] 42.41% | 7,620 | 6.7% |
[ 42.5% - 43.0% ] 42.75% | 7,988 | 3.1% |
[ 43.0% - 43.5% ] 43.20% | 2,014 | 9.8% |
[ 43.5% - 44.0% ] 43.80% | 2,219 | 2.5% |
[ 44.0% - 44.5% ] 44.37% | 1,510 | 3.7% |
[ 44.5% - 45.0% ] 44.84% | 4,525 | 2.9% |
[ 45.0% - 45.5% ] 45.37% | 2,832 | 4.4% |
[ 45.5% - 46.0% ] 45.73% | 2,718 | 8.2% |
[ 46.0% - 46.5% ] 46.30% | 1,782 | 3.8% |
[ 46.5% - 47.0% ] 46.97% | 824 | 5.5% |
[ 47.0% - 47.5% ] 47.16% | 2,935 | 2.7% |
[ 47.5% - 48.0% ] 47.67% | 2,878 | 2.2% |
[ 48.0% - 48.5% ] 48.31% | 3,991 | 2.0% |
[ 48.5% - 49.0% ] 48.70% | 2,548 | 4.0% |
[ 49.0% - 49.5% ] 49.29% | 1,828 | 2.3% |
[ 49.5% - 50.0% ] 49.74% | 1,341 | 9.0% |
[ 50.0% - 50.5% ] 50.33% | 1,842 | 5.4% |
[ 50.5% - 51.0% ] 50.65% | 2,318 | 2.5% |
[ 51.0% - 51.5% ] 51.18% | 551 | 2.4% |
[ 52.0% - 52.5% ] 52.40% | 229 | 12.2% |
[ 52.5% - 53.0% ] 52.88% | 312 | 21.8% |
[ 53.0% - 53.5% ] 53.44% | 1,091 | 2.9% |
[ 53.5% - 54.0% ] 53.71% | 1,888 | 2.3% |
[ 54.0% - 54.5% ] 54.21% | 725 | 1.8% |
[ 55.0% - 55.5% ] 55.47% | 2,650 | 1.2% |
[ 55.5% - 56.0% ] 55.53% | 407 | 7.2% |
[ 56.5% - 57.0% ] 56.76% | 895 | 4.3% |
[ 57.0% - 57.5% ] 57.14% | 168 | 2.4% |
[ 57.5% - 58.0% ] 57.69% | 338 | 39.0% |
[ 58.5% - 59.0% ] 58.63% | 498 | 17.9% |
[ 60.0% - 60.5% ] 60.17% | 241 | 13.2% |
[ 60.5% - 61.0% ] 60.61% | 33 | 50.0% |
[ 61.0% - 61.5% ] 61.36% | 88 | 5.6% |
[ 62.0% - 62.5% ] 62.07% | 29 | 50.0% |
[ 64.0% - 64.5% ] 64.02% | 264 | 1.6% |
[ 67.0% - 67.5% ] 67.22% | 180 | 11.5% |
[ 67.5% - 68.0% ] 67.74% | 155 | 8.0% |
[ 72.0% - 72.5% ] 72.04% | 279 | 3.7% |
[ 80.5% - 81.0% ] 80.70% | 114 | 5.9% |