Panamanian Married-Couple Family Poverty

COMPARE

Panamanian
Race
Ancestry
AfghanAfricanAlaska NativeAlaskan AthabascanAlbanianAleutAlsatianAmericanApacheArabArapahoArgentineanArmenianAssyrian/Chaldean/SyriacAustralianAustrianBahamianBangladeshiBarbadianBasqueBelgianBelizeanBermudanBhutaneseBlackfeetBolivianBrazilianBritishBritish West IndianBulgarianBurmeseCajunCambodianCanadianCape VerdeanCarpatho RusynCelticCentral AmericanCentral American IndianCherokeeCheyenneChickasawChileanChineseChippewaChoctawColombianColvilleComancheCosta RicanCreeCreekCroatianCrowCubanCypriotCzechCzechoslovakianDanishDelawareDominicanDutchDutch West IndianEastern EuropeanEcuadorianEgyptianEnglishEstonianEthiopianEuropeanFijianFilipinoFinnishFrenchFrench American IndianFrench CanadianGermanGerman RussianGhanaianGreekGuamanian/ChamorroGuatemalanGuyaneseHaitianHmongHonduranHopiHoumaHungarianIcelanderIndian (Asian)IndonesianInupiatIranianIraqiIrishIroquoisIsraeliItalianJamaicanJapaneseJordanianKenyanKiowaKoreanLaotianLatvianLebaneseLiberianLithuanianLumbeeLuxembourgerMacedonianMalaysianMalteseMarshalleseMenomineeMexicanMexican American IndianMongolianMoroccanNative HawaiianNavajoNepaleseNew ZealanderNicaraguanNigerianNorthern EuropeanNorwegianOkinawanOsageOttawaPaiutePakistaniPalestinianPanamanianParaguayanPennsylvania GermanPeruvianPimaPolishPortuguesePotawatomiPuebloPuerto RicanPuget Sound SalishRomanianRussianSalvadoranSamoanScandinavianScotch-IrishScottishSeminoleSenegaleseSerbianShoshoneSierra LeoneanSiouxSlavicSlovakSloveneSomaliSouth AfricanSouth AmericanSouth American IndianSoviet UnionSpaniardSpanishSpanish AmericanSpanish American IndianSri LankanSubsaharan AfricanSudaneseSwedishSwissSyrianTaiwaneseThaiTlingit-HaidaTohono O'OdhamTonganTrinidadian and TobagonianTsimshianTurkishU.S. Virgin IslanderUgandanUkrainianUruguayanUteVenezuelanVietnameseWelshWest IndianYakamaYaquiYugoslavianYumanYup'ikZimbabwean
Immigration
NonimmigrantsImmigrantsAfghanistanAfricaAlbaniaArgentinaArmeniaAsiaAustraliaAustriaBahamasBangladeshBarbadosBelarusBelgiumBelizeBoliviaBosnia and HerzegovinaBrazilBulgariaBurma/MyanmarCabo VerdeCambodiaCameroonCanadaCaribbeanCentral AmericaChileChinaColombiaCongoCosta RicaCroatiaCubaCzechoslovakiaDenmarkDominicaDominican RepublicEastern AfricaEastern AsiaEastern EuropeEcuadorEgyptEl SalvadorEnglandEritreaEthiopiaEuropeFijiFranceGermanyGhanaGreeceGrenadaGuatemalaGuyanaHaitiHondurasHong KongHungaryIndiaIndonesiaIranIraqIrelandIsraelItalyJamaicaJapanJordanKazakhstanKenyaKoreaKuwaitLaosLatin AmericaLatviaLebanonLiberiaLithuaniaMalaysiaMexicoMicronesiaMiddle AfricaMoldovaMoroccoNepalNetherlandsNicaraguaNigeriaNorth AmericaNorth MacedoniaNorthern AfricaNorthern EuropeNorwayOceaniaPakistanPanamaPeruPhilippinesPolandPortugalRomaniaRussiaSaudi ArabiaScotlandSenegalSerbiaSierra LeoneSingaporeSomaliaSouth AfricaSouth AmericaSouth Central AsiaSouth Eastern AsiaSouthern EuropeSpainSri LankaSt. Vincent and the GrenadinesSudanSwedenSwitzerlandSyriaTaiwanThailandTrinidad and TobagoTurkeyUgandaUkraineUruguayUzbekistanVenezuelaVietnamWest IndiesWestern AfricaWestern AsiaWestern EuropeYemenZaireZimbabweAzores
Select to Compare
Race
Ancestry
AfghanAfricanAlaska NativeAlaskan AthabascanAlbanianAleutAlsatianAmericanApacheArabArapahoArgentineanArmenianAssyrian/Chaldean/SyriacAustralianAustrianBahamianBangladeshiBarbadianBasqueBelgianBelizeanBermudanBhutaneseBlackfeetBolivianBrazilianBritishBritish West IndianBulgarianBurmeseCajunCambodianCanadianCape VerdeanCarpatho RusynCelticCentral AmericanCentral American IndianCherokeeCheyenneChickasawChileanChineseChippewaChoctawColombianColvilleComancheCosta RicanCreeCreekCroatianCrowCubanCypriotCzechCzechoslovakianDanishDelawareDominicanDutchDutch West IndianEastern EuropeanEcuadorianEgyptianEnglishEstonianEthiopianEuropeanFijianFilipinoFinnishFrenchFrench American IndianFrench CanadianGermanGerman RussianGhanaianGreekGuamanian/ChamorroGuatemalanGuyaneseHaitianHmongHonduranHopiHoumaHungarianIcelanderIndian (Asian)IndonesianInupiatIranianIraqiIrishIroquoisIsraeliItalianJamaicanJapaneseJordanianKenyanKiowaKoreanLaotianLatvianLebaneseLiberianLithuanianLumbeeLuxembourgerMacedonianMalaysianMalteseMarshalleseMenomineeMexicanMexican American IndianMongolianMoroccanNative HawaiianNavajoNepaleseNew ZealanderNicaraguanNigerianNorthern EuropeanNorwegianOkinawanOsageOttawaPaiutePakistaniPalestinianParaguayanPennsylvania GermanPeruvianPimaPolishPortuguesePotawatomiPuebloPuerto RicanPuget Sound SalishRomanianRussianSalvadoranSamoanScandinavianScotch-IrishScottishSeminoleSenegaleseSerbianShoshoneSierra LeoneanSiouxSlavicSlovakSloveneSomaliSouth AfricanSouth AmericanSouth American IndianSoviet UnionSpaniardSpanishSpanish AmericanSpanish American IndianSri LankanSubsaharan AfricanSudaneseSwedishSwissSyrianTaiwaneseThaiTlingit-HaidaTohono O'OdhamTonganTrinidadian and TobagonianTsimshianTurkishU.S. Virgin IslanderUgandanUkrainianUruguayanUteVenezuelanVietnameseWelshWest IndianYakamaYaquiYugoslavianYumanYup'ikZimbabwean
Immigration
NonimmigrantsImmigrantsAfghanistanAfricaAlbaniaArgentinaArmeniaAsiaAustraliaAustriaBahamasBangladeshBarbadosBelarusBelgiumBelizeBoliviaBosnia and HerzegovinaBrazilBulgariaBurma/MyanmarCabo VerdeCambodiaCameroonCanadaCaribbeanCentral AmericaChileChinaColombiaCongoCosta RicaCroatiaCubaCzechoslovakiaDenmarkDominicaDominican RepublicEastern AfricaEastern AsiaEastern EuropeEcuadorEgyptEl SalvadorEnglandEritreaEthiopiaEuropeFijiFranceGermanyGhanaGreeceGrenadaGuatemalaGuyanaHaitiHondurasHong KongHungaryIndiaIndonesiaIranIraqIrelandIsraelItalyJamaicaJapanJordanKazakhstanKenyaKoreaKuwaitLaosLatin AmericaLatviaLebanonLiberiaLithuaniaMalaysiaMexicoMicronesiaMiddle AfricaMoldovaMoroccoNepalNetherlandsNicaraguaNigeriaNorth AmericaNorth MacedoniaNorthern AfricaNorthern EuropeNorwayOceaniaPakistanPanamaPeruPhilippinesPolandPortugalRomaniaRussiaSaudi ArabiaScotlandSenegalSerbiaSierra LeoneSingaporeSomaliaSouth AfricaSouth AmericaSouth Central AsiaSouth Eastern AsiaSouthern EuropeSpainSri LankaSt. Vincent and the GrenadinesSudanSwedenSwitzerlandSyriaTaiwanThailandTrinidad and TobagoTurkeyUgandaUkraineUruguayUzbekistanVenezuelaVietnamWest IndiesWestern AfricaWestern AsiaWestern EuropeYemenZaireZimbabweAzores
Married-Couple Family Poverty
Income
Poverty
Unemployment
Labor Participation
Family Structure
Vehicle Availability
Education Level
Disability

Panamanian Married-Couple Family Poverty
Tragic

5.6%
POVERTY | MARRIED-COUPLE FAMILIES
9.2/ 100
METRIC RATING
221st/ 347
METRIC RANK

Panamanian Married-Couple Family Poverty Correlation Chart

The statistical analysis conducted on geographies consisting of 279,759,434 people shows a slight negative correlation between the proportion of Panamanians and poverty level among married-couple families in the United States with a correlation coefficient (R) of -0.073 and weighted average of 5.6%. On average, for every 1% (one percent) increase in Panamanians within a typical geography, there is a decrease of 0.058% in poverty level among married-couple families.
Panamanian Married-Couple Family Poverty
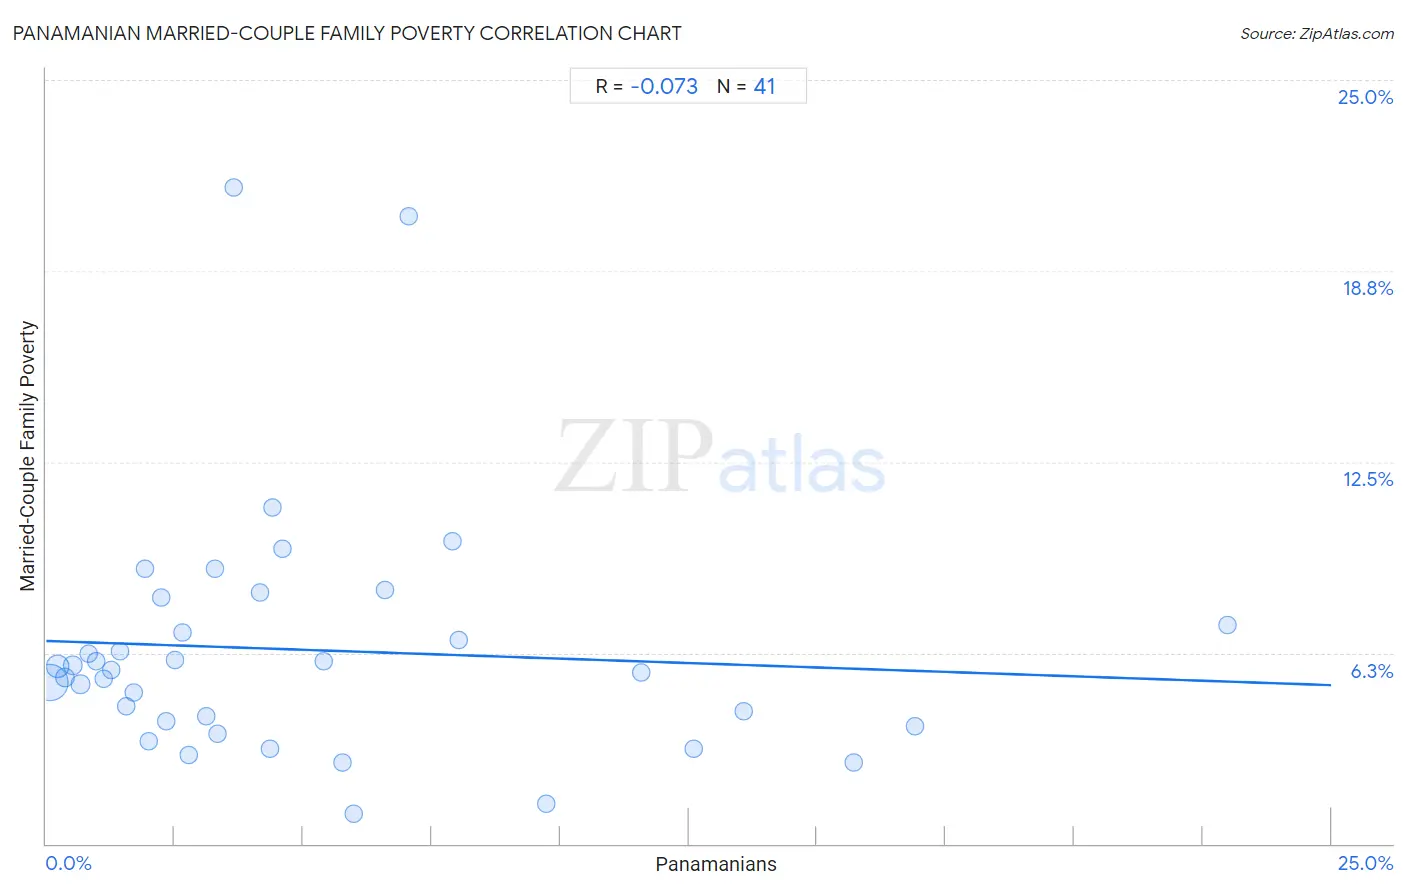
It is essential to understand that the correlation between the percentage of Panamanians and poverty level among married-couple families does not imply a direct cause-and-effect relationship. It remains uncertain whether the presence of Panamanians influences an upward or downward trend in the level of poverty level among married-couple families within an area, or if Panamanians simply ended up residing in those areas with higher or lower levels of poverty level among married-couple families due to other factors.

Demographics Similar to Panamanians by Married-Couple Family Poverty

In terms of married-couple family poverty, the demographic groups most similar to Panamanians are Colombian (5.6%, a difference of 0.020%), Japanese (5.6%, a difference of 0.21%), Afghan (5.5%, a difference of 0.61%), Immigrants from Nigeria (5.5%, a difference of 0.63%), and Cajun (5.6%, a difference of 0.85%).
DemographicsRating | RankMarried-Couple Family Poverty
Iroquois
13.1
/100
|
#214
Poor
5.5%
Armenians
12.8
/100
|
#215
Poor
5.5%
Potawatomi
12.4
/100
|
#216
Poor
5.5%
Immigrants from Nigeria
11.3
/100
|
#217
Poor
5.5%
Afghans
11.2
/100
|
#218
Poor
5.5%
Japanese
9.8
/100
|
#219
Tragic
5.6%
Colombians
9.2
/100
|
#220
Tragic
5.6%
Panamanians
9.2
/100
|
#221
Tragic
5.6%
Cajuns
6.9
/100
|
#222
Tragic
5.6%
Immigrants from Fiji
6.7
/100
|
#223
Tragic
5.6%
Sudanese
6.4
/100
|
#224
Tragic
5.6%
Immigrants from Cambodia
6.1
/100
|
#225
Tragic
5.6%
South Americans
5.7
/100
|
#226
Tragic
5.6%
Immigrants from Zaire
5.6
/100
|
#227
Tragic
5.6%
Arabs
5.4
/100
|
#228
Tragic
5.7%

Panamanian Married-Couple Family Poverty Correlation Summary

MeasurementPanamanian DataMarried-Couple Family Poverty Data
Minimum0.062%0.96%
Maximum23.0%21.5%
Range22.9%20.5%
Mean5.1%6.3%
Median3.3%5.7%
Interquartile 25% (IQ1)1.5%3.9%
Interquartile 75% (IQ3)6.8%7.6%
Interquartile Range (IQR)5.3%3.7%
Standard Deviation (Sample)5.2%4.1%
Standard Deviation (Population)5.1%4.0%

Correlation Details

Panamanian PercentileSample SizeMarried-Couple Family Poverty
[
0.0%
-
0.5%
]
0.062%
199,691,4795.3%
[
0.0%
-
0.5%
]
0.22%
51,111,4995.8%
[
0.0%
-
0.5%
]
0.36%
14,031,8825.4%
[
0.5%
-
1.0%
]
0.52%
6,268,5905.8%
[
0.5%
-
1.0%
]
0.67%
3,168,4615.2%
[
0.5%
-
1.0%
]
0.83%
1,858,8406.2%
[
0.5%
-
1.0%
]
0.97%
1,385,1746.0%
[
1.0%
-
1.5%
]
1.12%
588,1525.4%
[
1.0%
-
1.5%
]
1.26%
524,8325.7%
[
1.0%
-
1.5%
]
1.42%
346,8266.3%
[
1.5%
-
2.0%
]
1.55%
425,7934.5%
[
1.5%
-
2.0%
]
1.70%
116,8265.0%
[
1.5%
-
2.0%
]
1.91%
35,1699.0%
[
2.0%
-
2.5%
]
2.00%
37,4083.4%
[
2.0%
-
2.5%
]
2.24%
16,0168.1%
[
2.0%
-
2.5%
]
2.33%
31,7204.0%
[
2.5%
-
3.0%
]
2.50%
6,0726.0%
[
2.5%
-
3.0%
]
2.65%
11,8686.9%
[
2.5%
-
3.0%
]
2.77%
25,6092.9%
[
3.0%
-
3.5%
]
3.12%
26,8254.2%
[
3.0%
-
3.5%
]
3.27%
8,5599.0%
[
3.0%
-
3.5%
]
3.34%
8,1843.6%
[
3.5%
-
4.0%
]
3.66%
1,25821.5%
[
4.0%
-
4.5%
]
4.15%
4,5508.2%
[
4.0%
-
4.5%
]
4.36%
4823.1%
[
4.0%
-
4.5%
]
4.41%
4,87611.0%
[
4.5%
-
5.0%
]
4.60%
6319.7%
[
5.0%
-
5.5%
]
5.39%
7,0446.0%
[
5.5%
-
6.0%
]
5.75%
9912.6%
[
5.5%
-
6.0%
]
5.98%
3,3600.96%
[
6.5%
-
7.0%
]
6.60%
1,4398.3%
[
7.0%
-
7.5%
]
7.06%
1,84120.5%
[
7.5%
-
8.0%
]
7.89%
2,7249.9%
[
8.0%
-
8.5%
]
8.02%
1,0476.7%
[
9.5%
-
10.0%
]
9.73%
5141.3%
[
11.5%
-
12.0%
]
11.58%
1,0025.6%
[
12.5%
-
13.0%
]
12.59%
1353.1%
[
13.5%
-
14.0%
]
13.58%
9724.3%
[
15.5%
-
16.0%
]
15.70%
4142.7%
[
16.5%
-
17.0%
]
16.89%
2963.8%
[
22.5%
-
23.0%
]
22.97%
747.1%