Immigrants from Europe Married-Couple Family Poverty
COMPARE
Immigrants from Europe
Select to Compare
Married-Couple Family Poverty
Immigrants from Europe Married-Couple Family Poverty
4.6%
POVERTY | MARRIED-COUPLE FAMILIES
97.9/ 100
METRIC RATING
99th/ 347
METRIC RANK
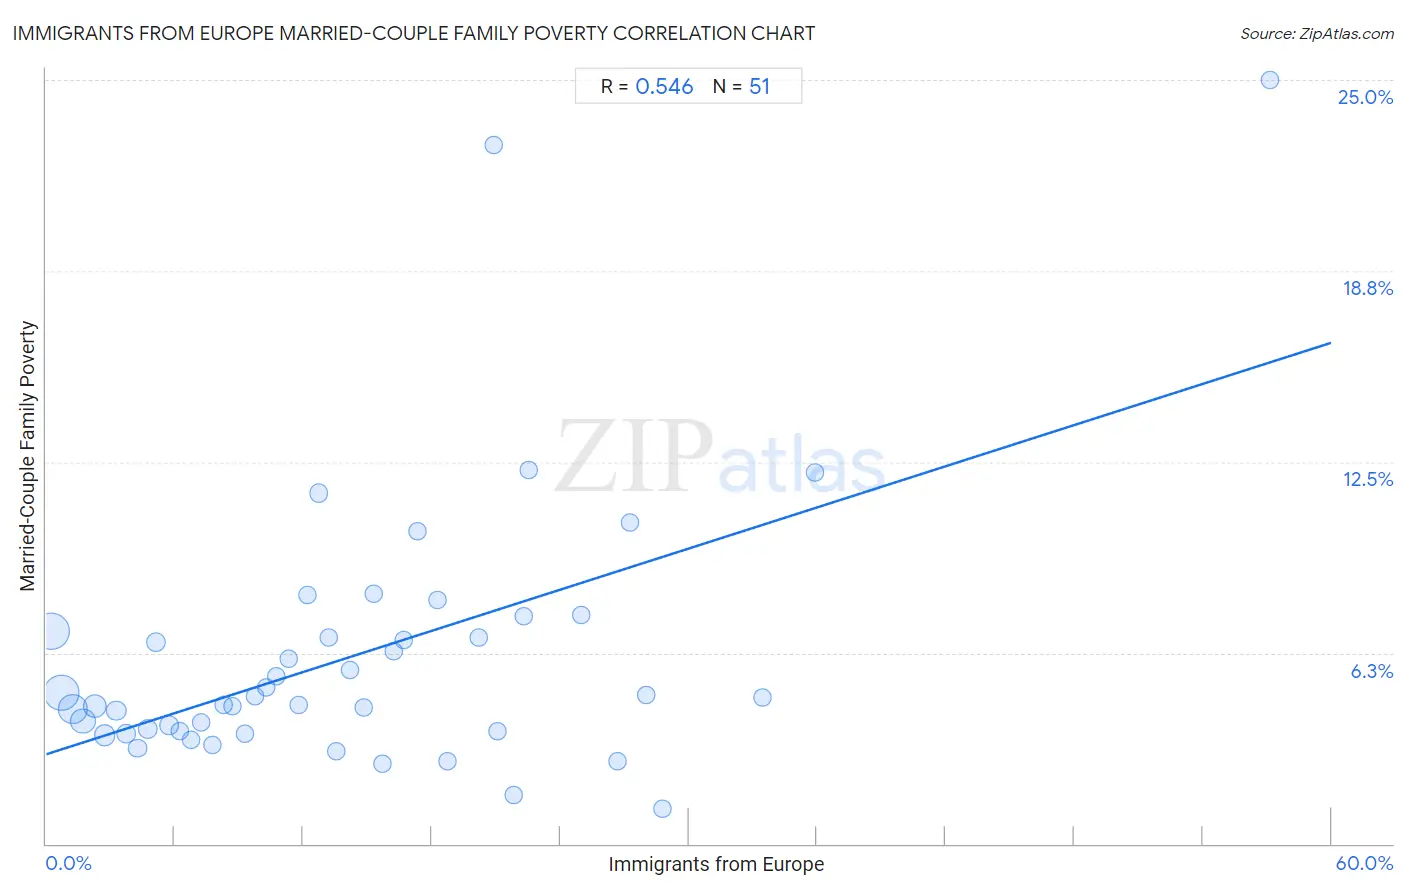
Immigrants from Europe Married-Couple Family Poverty Correlation Chart
The statistical analysis conducted on geographies consisting of 535,803,847 people shows a substantial positive correlation between the proportion of Immigrants from Europe and poverty level among married-couple families in the United States with a correlation coefficient (R) of 0.546 and weighted average of 4.6%. On average, for every 1% (one percent) increase in Immigrants from Europe within a typical geography, there is an increase of 0.22% in poverty level among married-couple families.
It is essential to understand that the correlation between the percentage of Immigrants from Europe and poverty level among married-couple families does not imply a direct cause-and-effect relationship. It remains uncertain whether the presence of Immigrants from Europe influences an upward or downward trend in the level of poverty level among married-couple families within an area, or if Immigrants from Europe simply ended up residing in those areas with higher or lower levels of poverty level among married-couple families due to other factors.
Demographics Similar to Immigrants from Europe by Married-Couple Family Poverty
In terms of married-couple family poverty, the demographic groups most similar to Immigrants from Europe are Immigrants from Western Europe (4.6%, a difference of 0.11%), Native Hawaiian (4.6%, a difference of 0.12%), Yugoslavian (4.6%, a difference of 0.13%), Asian (4.7%, a difference of 0.53%), and Immigrants from Belgium (4.6%, a difference of 0.54%).
| Demographics | Rating | Rank | Married-Couple Family Poverty |
| Immigrants from Norway | 98.4 /100 | #92 | Exceptional 4.6% |
| Koreans | 98.3 /100 | #93 | Exceptional 4.6% |
| Immigrants from Italy | 98.3 /100 | #94 | Exceptional 4.6% |
| Portuguese | 98.3 /100 | #95 | Exceptional 4.6% |
| Immigrants from Poland | 98.3 /100 | #96 | Exceptional 4.6% |
| Immigrants from Belgium | 98.2 /100 | #97 | Exceptional 4.6% |
| Native Hawaiians | 98.0 /100 | #98 | Exceptional 4.6% |
| Immigrants from Europe | 97.9 /100 | #99 | Exceptional 4.6% |
| Immigrants from Western Europe | 97.9 /100 | #100 | Exceptional 4.6% |
| Yugoslavians | 97.8 /100 | #101 | Exceptional 4.6% |
| Asians | 97.6 /100 | #102 | Exceptional 4.7% |
| Immigrants from Romania | 97.3 /100 | #103 | Exceptional 4.7% |
| Immigrants from Moldova | 97.1 /100 | #104 | Exceptional 4.7% |
| Aleuts | 97.0 /100 | #105 | Exceptional 4.7% |
| Immigrants from France | 96.9 /100 | #106 | Exceptional 4.7% |
Immigrants from Europe Married-Couple Family Poverty Correlation Summary
| Measurement | Immigrants from Europe Data | Married-Couple Family Poverty Data |
| Minimum | 0.26% | 1.2% |
| Maximum | 57.1% | 25.0% |
| Range | 56.9% | 23.8% |
| Mean | 14.4% | 6.2% |
| Median | 12.7% | 4.8% |
| Interquartile 25% (IQ1) | 6.2% | 3.7% |
| Interquartile 75% (IQ3) | 20.9% | 7.0% |
| Interquartile Range (IQR) | 14.7% | 3.3% |
| Standard Deviation (Sample) | 10.8% | 4.4% |
| Standard Deviation (Population) | 10.7% | 4.4% |
Correlation Details
| Immigrants from Europe Percentile | Sample Size | Married-Couple Family Poverty |
[ 0.0% - 0.5% ] 0.26% | 140,449,330 | 7.0% |
[ 0.5% - 1.0% ] 0.72% | 127,656,759 | 5.0% |
[ 1.0% - 1.5% ] 1.24% | 79,770,149 | 4.4% |
[ 1.5% - 2.0% ] 1.72% | 49,885,981 | 4.0% |
[ 2.0% - 2.5% ] 2.25% | 39,617,470 | 4.5% |
[ 2.5% - 3.0% ] 2.74% | 23,195,423 | 3.6% |
[ 3.0% - 3.5% ] 3.25% | 18,375,231 | 4.4% |
[ 3.5% - 4.0% ] 3.72% | 10,415,915 | 3.6% |
[ 4.0% - 4.5% ] 4.24% | 8,296,558 | 3.1% |
[ 4.5% - 5.0% ] 4.73% | 5,436,405 | 3.8% |
[ 5.0% - 5.5% ] 5.13% | 14,196,147 | 6.6% |
[ 5.5% - 6.0% ] 5.74% | 4,085,310 | 3.9% |
[ 6.0% - 6.5% ] 6.24% | 2,643,103 | 3.7% |
[ 6.5% - 7.0% ] 6.76% | 2,436,931 | 3.4% |
[ 7.0% - 7.5% ] 7.23% | 1,431,463 | 4.0% |
[ 7.5% - 8.0% ] 7.75% | 1,203,820 | 3.2% |
[ 8.0% - 8.5% ] 8.27% | 910,967 | 4.6% |
[ 8.5% - 9.0% ] 8.72% | 782,555 | 4.5% |
[ 9.0% - 9.5% ] 9.26% | 794,147 | 3.6% |
[ 9.5% - 10.0% ] 9.75% | 468,614 | 4.8% |
[ 10.0% - 10.5% ] 10.28% | 618,256 | 5.1% |
[ 10.5% - 11.0% ] 10.76% | 108,474 | 5.5% |
[ 11.0% - 11.5% ] 11.30% | 296,725 | 6.1% |
[ 11.5% - 12.0% ] 11.77% | 484,393 | 4.5% |
[ 12.0% - 12.5% ] 12.21% | 388,116 | 8.2% |
[ 12.5% - 13.0% ] 12.74% | 172,540 | 11.5% |
[ 13.0% - 13.5% ] 13.21% | 288,595 | 6.7% |
[ 13.5% - 14.0% ] 13.54% | 121,424 | 3.0% |
[ 14.0% - 14.5% ] 14.19% | 231,147 | 5.7% |
[ 14.5% - 15.0% ] 14.80% | 139,455 | 4.5% |
[ 15.0% - 15.5% ] 15.30% | 237,814 | 8.2% |
[ 15.5% - 16.0% ] 15.71% | 38,305 | 2.6% |
[ 16.0% - 16.5% ] 16.24% | 53,720 | 6.3% |
[ 16.5% - 17.0% ] 16.68% | 120,932 | 6.7% |
[ 17.0% - 17.5% ] 17.35% | 81,109 | 10.2% |
[ 18.0% - 18.5% ] 18.24% | 37,105 | 8.0% |
[ 18.5% - 19.0% ] 18.76% | 3,566 | 2.7% |
[ 20.0% - 20.5% ] 20.18% | 64,944 | 6.7% |
[ 20.5% - 21.0% ] 20.92% | 153 | 22.9% |
[ 21.0% - 21.5% ] 21.05% | 29,633 | 3.7% |
[ 21.5% - 22.0% ] 21.83% | 1,864 | 1.6% |
[ 22.0% - 22.5% ] 22.30% | 2,049 | 7.4% |
[ 22.5% - 23.0% ] 22.53% | 648 | 12.2% |
[ 25.0% - 25.5% ] 25.00% | 300 | 7.5% |
[ 26.5% - 27.0% ] 26.65% | 17,166 | 2.7% |
[ 27.0% - 27.5% ] 27.26% | 72,126 | 10.5% |
[ 28.0% - 28.5% ] 28.03% | 23,200 | 4.9% |
[ 28.5% - 29.0% ] 28.80% | 8,942 | 1.2% |
[ 33.0% - 33.5% ] 33.42% | 25,666 | 4.8% |
[ 35.5% - 36.0% ] 35.90% | 83,069 | 12.1% |
[ 57.0% - 57.5% ] 57.14% | 133 | 25.0% |