Dutch Married-Couple Family Poverty
COMPARE
Dutch
Select to Compare
Married-Couple Family Poverty
Dutch Married-Couple Family Poverty
4.2%
POVERTY | MARRIED-COUPLE FAMILIES
99.9/ 100
METRIC RATING
34th/ 347
METRIC RANK
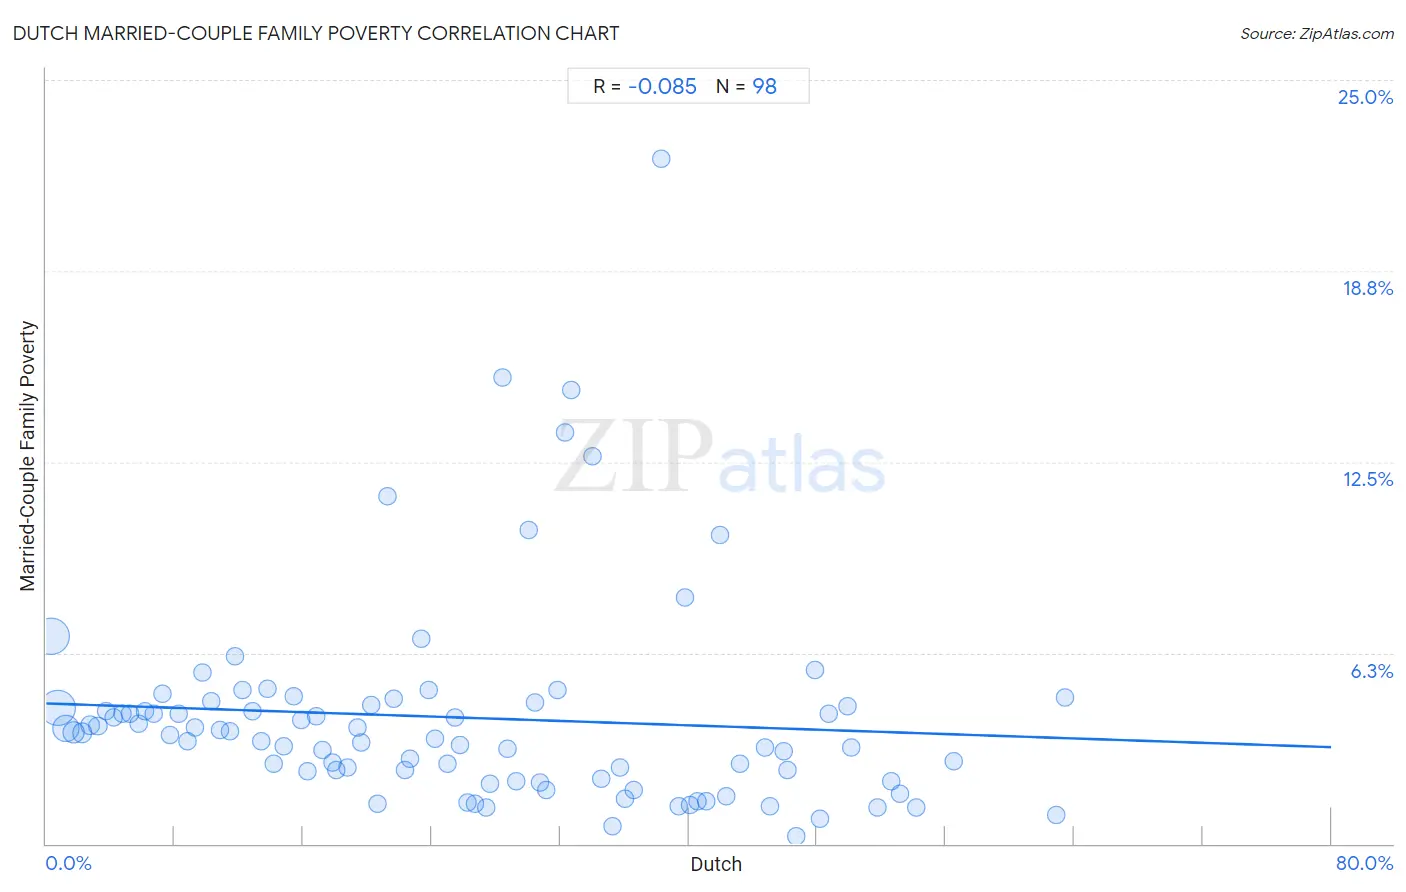
Dutch Married-Couple Family Poverty Correlation Chart
The statistical analysis conducted on geographies consisting of 541,561,341 people shows a slight negative correlation between the proportion of Dutch and poverty level among married-couple families in the United States with a correlation coefficient (R) of -0.085 and weighted average of 4.2%. On average, for every 1% (one percent) increase in Dutch within a typical geography, there is a decrease of 0.018% in poverty level among married-couple families.
It is essential to understand that the correlation between the percentage of Dutch and poverty level among married-couple families does not imply a direct cause-and-effect relationship. It remains uncertain whether the presence of Dutch influences an upward or downward trend in the level of poverty level among married-couple families within an area, or if Dutch simply ended up residing in those areas with higher or lower levels of poverty level among married-couple families due to other factors.
Demographics Similar to Dutch by Married-Couple Family Poverty
In terms of married-couple family poverty, the demographic groups most similar to Dutch are Irish (4.2%, a difference of 0.23%), European (4.2%, a difference of 0.57%), English (4.2%, a difference of 0.60%), Iranian (4.2%, a difference of 0.67%), and Greek (4.2%, a difference of 0.71%).
| Demographics | Rating | Rank | Married-Couple Family Poverty |
| Danes | 99.9 /100 | #27 | Exceptional 4.1% |
| Scandinavians | 99.9 /100 | #28 | Exceptional 4.1% |
| Immigrants from Scotland | 99.9 /100 | #29 | Exceptional 4.2% |
| Finns | 99.9 /100 | #30 | Exceptional 4.2% |
| Estonians | 99.9 /100 | #31 | Exceptional 4.2% |
| Greeks | 99.9 /100 | #32 | Exceptional 4.2% |
| Irish | 99.9 /100 | #33 | Exceptional 4.2% |
| Dutch | 99.9 /100 | #34 | Exceptional 4.2% |
| Europeans | 99.9 /100 | #35 | Exceptional 4.2% |
| English | 99.9 /100 | #36 | Exceptional 4.2% |
| Iranians | 99.9 /100 | #37 | Exceptional 4.2% |
| Belgians | 99.9 /100 | #38 | Exceptional 4.2% |
| Immigrants from Northern Europe | 99.8 /100 | #39 | Exceptional 4.2% |
| French Canadians | 99.8 /100 | #40 | Exceptional 4.2% |
| Northern Europeans | 99.8 /100 | #41 | Exceptional 4.3% |
Dutch Married-Couple Family Poverty Correlation Summary
| Measurement | Dutch Data | Married-Couple Family Poverty Data |
| Minimum | 0.27% | 0.25% |
| Maximum | 63.4% | 22.4% |
| Range | 63.2% | 22.2% |
| Mean | 25.9% | 4.1% |
| Median | 24.6% | 3.6% |
| Interquartile 25% (IQ1) | 12.2% | 2.1% |
| Interquartile 75% (IQ3) | 39.4% | 4.5% |
| Interquartile Range (IQR) | 27.2% | 2.4% |
| Standard Deviation (Sample) | 16.3% | 3.4% |
| Standard Deviation (Population) | 16.2% | 3.4% |
Correlation Details
| Dutch Percentile | Sample Size | Married-Couple Family Poverty |
[ 0.0% - 0.5% ] 0.27% | 190,276,798 | 6.8% |
[ 0.5% - 1.0% ] 0.74% | 170,541,133 | 4.4% |
[ 1.0% - 1.5% ] 1.22% | 95,763,043 | 3.8% |
[ 1.5% - 2.0% ] 1.72% | 40,850,995 | 3.6% |
[ 2.0% - 2.5% ] 2.23% | 18,284,280 | 3.6% |
[ 2.5% - 3.0% ] 2.71% | 9,050,073 | 3.9% |
[ 3.0% - 3.5% ] 3.22% | 4,807,138 | 3.9% |
[ 3.5% - 4.0% ] 3.73% | 2,755,663 | 4.4% |
[ 4.0% - 4.5% ] 4.21% | 1,699,583 | 4.1% |
[ 4.5% - 5.0% ] 4.75% | 1,167,061 | 4.3% |
[ 5.0% - 5.5% ] 5.24% | 788,359 | 4.3% |
[ 5.5% - 6.0% ] 5.77% | 717,119 | 3.9% |
[ 6.0% - 6.5% ] 6.18% | 547,280 | 4.3% |
[ 6.5% - 7.0% ] 6.71% | 352,405 | 4.3% |
[ 7.0% - 7.5% ] 7.22% | 318,332 | 4.9% |
[ 7.5% - 8.0% ] 7.69% | 295,989 | 3.6% |
[ 8.0% - 8.5% ] 8.24% | 233,836 | 4.2% |
[ 8.5% - 9.0% ] 8.79% | 302,944 | 3.3% |
[ 9.0% - 9.5% ] 9.25% | 231,115 | 3.8% |
[ 9.5% - 10.0% ] 9.72% | 135,214 | 5.6% |
[ 10.0% - 10.5% ] 10.25% | 161,597 | 4.7% |
[ 10.5% - 11.0% ] 10.79% | 118,952 | 3.7% |
[ 11.0% - 11.5% ] 11.40% | 81,806 | 3.7% |
[ 11.5% - 12.0% ] 11.77% | 57,428 | 6.1% |
[ 12.0% - 12.5% ] 12.20% | 258,402 | 5.0% |
[ 12.5% - 13.0% ] 12.81% | 100,086 | 4.3% |
[ 13.0% - 13.5% ] 13.41% | 81,459 | 3.4% |
[ 13.5% - 14.0% ] 13.79% | 75,945 | 5.1% |
[ 14.0% - 14.5% ] 14.16% | 64,944 | 2.6% |
[ 14.5% - 15.0% ] 14.76% | 101,547 | 3.2% |
[ 15.0% - 15.5% ] 15.40% | 39,183 | 4.8% |
[ 15.5% - 16.0% ] 15.84% | 172,936 | 4.0% |
[ 16.0% - 16.5% ] 16.23% | 181,731 | 2.4% |
[ 16.5% - 17.0% ] 16.77% | 22,919 | 4.2% |
[ 17.0% - 17.5% ] 17.20% | 54,503 | 3.1% |
[ 17.5% - 18.0% ] 17.81% | 75,518 | 2.6% |
[ 18.0% - 18.5% ] 18.07% | 45,095 | 2.4% |
[ 18.5% - 19.0% ] 18.75% | 29,003 | 2.5% |
[ 19.0% - 19.5% ] 19.37% | 64,037 | 3.8% |
[ 19.5% - 20.0% ] 19.60% | 19,187 | 3.3% |
[ 20.0% - 20.5% ] 20.23% | 8,785 | 4.5% |
[ 20.5% - 21.0% ] 20.66% | 13,791 | 1.3% |
[ 21.0% - 21.5% ] 21.25% | 6,353 | 11.4% |
[ 21.5% - 22.0% ] 21.63% | 3,185 | 4.8% |
[ 22.0% - 22.5% ] 22.34% | 32,178 | 2.4% |
[ 22.5% - 23.0% ] 22.65% | 81,432 | 2.8% |
[ 23.0% - 23.5% ] 23.32% | 5,387 | 6.7% |
[ 23.5% - 24.0% ] 23.77% | 16,530 | 5.1% |
[ 24.0% - 24.5% ] 24.23% | 49,369 | 3.5% |
[ 24.5% - 25.0% ] 24.97% | 793 | 2.6% |
[ 25.0% - 25.5% ] 25.48% | 32,328 | 4.1% |
[ 25.5% - 26.0% ] 25.76% | 1,646 | 3.2% |
[ 26.0% - 26.5% ] 26.25% | 4,967 | 1.3% |
[ 26.5% - 27.0% ] 26.66% | 28,873 | 1.3% |
[ 27.0% - 27.5% ] 27.41% | 19,769 | 1.2% |
[ 27.5% - 28.0% ] 27.63% | 4,730 | 1.9% |
[ 28.0% - 28.5% ] 28.43% | 1,305 | 15.2% |
[ 28.5% - 29.0% ] 28.73% | 63,301 | 3.1% |
[ 29.0% - 29.5% ] 29.27% | 17,442 | 2.1% |
[ 30.0% - 30.5% ] 30.00% | 440 | 10.3% |
[ 30.0% - 30.5% ] 30.41% | 7,273 | 4.6% |
[ 30.5% - 31.0% ] 30.77% | 156 | 2.0% |
[ 31.0% - 31.5% ] 31.13% | 30,444 | 1.7% |
[ 31.5% - 32.0% ] 31.82% | 6,882 | 5.0% |
[ 32.0% - 32.5% ] 32.31% | 1,826 | 13.5% |
[ 32.5% - 33.0% ] 32.68% | 1,536 | 14.9% |
[ 34.0% - 34.5% ] 34.00% | 550 | 12.7% |
[ 34.5% - 35.0% ] 34.59% | 876 | 2.1% |
[ 35.0% - 35.5% ] 35.27% | 879 | 0.56% |
[ 35.5% - 36.0% ] 35.72% | 4,972 | 2.5% |
[ 36.0% - 36.5% ] 36.06% | 27,909 | 1.5% |
[ 36.5% - 37.0% ] 36.60% | 3,989 | 1.8% |
[ 38.0% - 38.5% ] 38.27% | 196 | 22.4% |
[ 39.0% - 39.5% ] 39.36% | 719 | 1.2% |
[ 39.5% - 40.0% ] 39.75% | 478 | 8.1% |
[ 40.0% - 40.5% ] 40.09% | 23,015 | 1.3% |
[ 40.5% - 41.0% ] 40.54% | 30,231 | 1.4% |
[ 41.0% - 41.5% ] 41.12% | 40,439 | 1.4% |
[ 41.5% - 42.0% ] 41.92% | 1,281 | 10.1% |
[ 42.0% - 42.5% ] 42.37% | 7,116 | 1.5% |
[ 43.0% - 43.5% ] 43.15% | 7,807 | 2.6% |
[ 44.5% - 45.0% ] 44.78% | 8,483 | 3.1% |
[ 45.0% - 45.5% ] 45.08% | 4,887 | 1.2% |
[ 45.5% - 46.0% ] 45.93% | 246 | 3.0% |
[ 46.0% - 46.5% ] 46.16% | 2,424 | 2.4% |
[ 46.5% - 47.0% ] 46.65% | 1,629 | 0.25% |
[ 47.5% - 48.0% ] 47.85% | 1,421 | 5.7% |
[ 48.0% - 48.5% ] 48.17% | 1,478 | 0.83% |
[ 48.5% - 49.0% ] 48.68% | 7,130 | 4.2% |
[ 49.5% - 50.0% ] 49.87% | 1,191 | 4.5% |
[ 50.0% - 50.5% ] 50.13% | 10,131 | 3.1% |
[ 51.5% - 52.0% ] 51.76% | 1,022 | 1.2% |
[ 52.5% - 53.0% ] 52.62% | 515 | 2.0% |
[ 53.0% - 53.5% ] 53.12% | 642 | 1.6% |
[ 54.0% - 54.5% ] 54.14% | 2,063 | 1.2% |
[ 56.5% - 57.0% ] 56.52% | 575 | 2.7% |
[ 62.5% - 63.0% ] 62.87% | 676 | 0.95% |
[ 63.0% - 63.5% ] 63.44% | 1,012 | 4.8% |