Immigrants from Vietnam Married-Couple Family Poverty
COMPARE
Immigrants from Vietnam
Select to Compare
Married-Couple Family Poverty
Immigrants from Vietnam Married-Couple Family Poverty
5.3%
POVERTY | MARRIED-COUPLE FAMILIES
37.7/ 100
METRIC RATING
182nd/ 347
METRIC RANK
Immigrants from Vietnam Married-Couple Family Poverty Correlation Chart
The statistical analysis conducted on geographies consisting of 401,742,374 people shows a poor positive correlation between the proportion of Immigrants from Vietnam and poverty level among married-couple families in the United States with a correlation coefficient (R) of 0.199 and weighted average of 5.3%. On average, for every 1% (one percent) increase in Immigrants from Vietnam within a typical geography, there is an increase of 0.057% in poverty level among married-couple families.
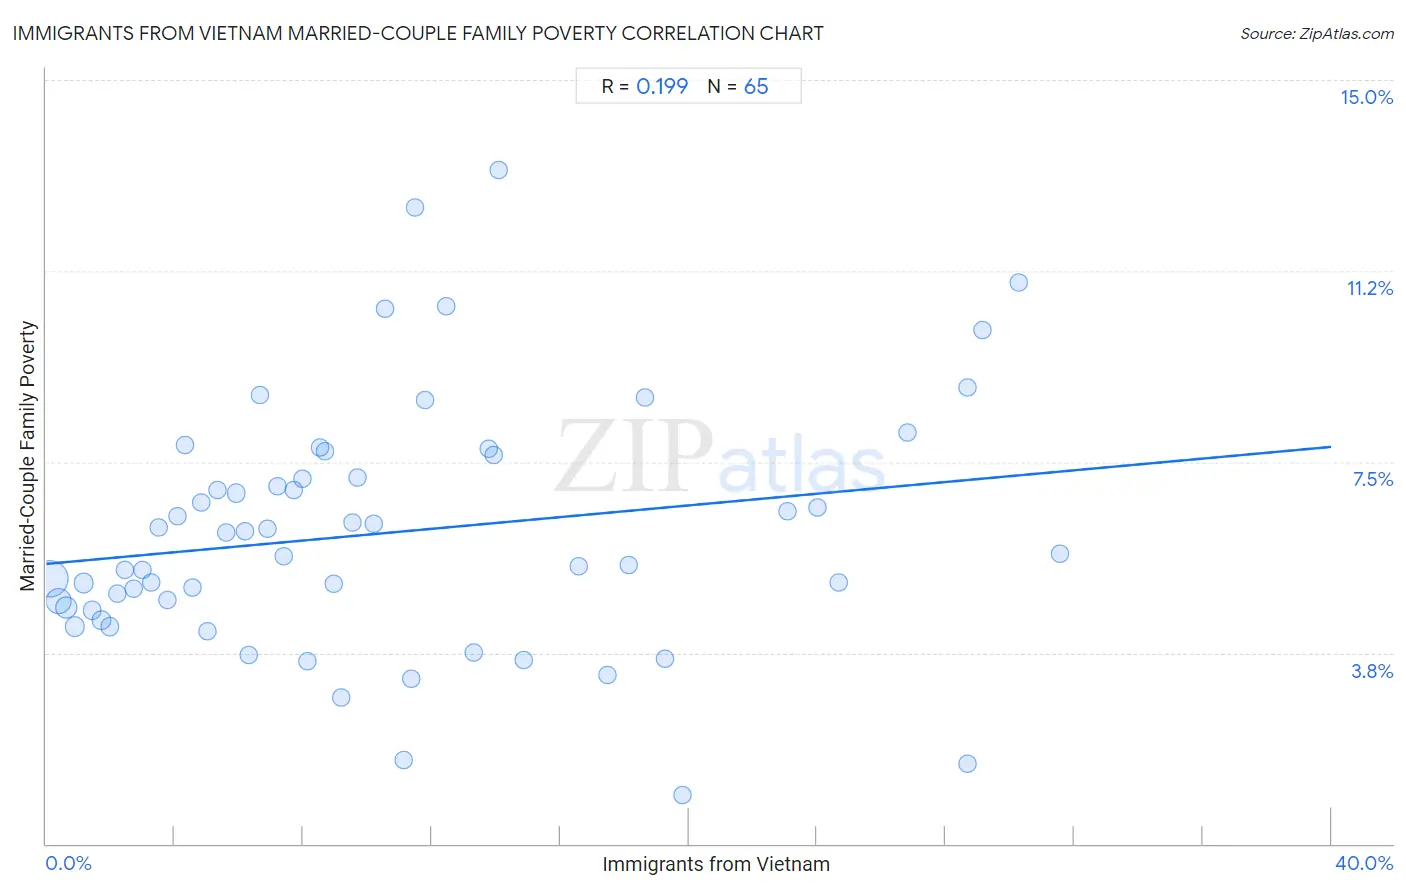
It is essential to understand that the correlation between the percentage of Immigrants from Vietnam and poverty level among married-couple families does not imply a direct cause-and-effect relationship. It remains uncertain whether the presence of Immigrants from Vietnam influences an upward or downward trend in the level of poverty level among married-couple families within an area, or if Immigrants from Vietnam simply ended up residing in those areas with higher or lower levels of poverty level among married-couple families due to other factors.
Demographics Similar to Immigrants from Vietnam by Married-Couple Family Poverty
In terms of married-couple family poverty, the demographic groups most similar to Immigrants from Vietnam are Peruvian (5.3%, a difference of 0.010%), Immigrants from Chile (5.3%, a difference of 0.13%), Immigrants from Sierra Leone (5.3%, a difference of 0.18%), Nonimmigrants (5.3%, a difference of 0.24%), and American (5.3%, a difference of 0.29%).
| Demographics | Rating | Rank | Married-Couple Family Poverty |
| Marshallese | 47.9 /100 | #175 | Average 5.2% |
| Menominee | 47.8 /100 | #176 | Average 5.2% |
| Immigrants from Kazakhstan | 45.1 /100 | #177 | Average 5.2% |
| Immigrants from Ukraine | 44.9 /100 | #178 | Average 5.2% |
| Spanish | 41.4 /100 | #179 | Average 5.3% |
| Immigrants from Sierra Leone | 39.3 /100 | #180 | Fair 5.3% |
| Immigrants from Chile | 38.8 /100 | #181 | Fair 5.3% |
| Immigrants from Vietnam | 37.7 /100 | #182 | Fair 5.3% |
| Peruvians | 37.6 /100 | #183 | Fair 5.3% |
| Nonimmigrants | 35.8 /100 | #184 | Fair 5.3% |
| Americans | 35.4 /100 | #185 | Fair 5.3% |
| Hungarians | 34.7 /100 | #186 | Fair 5.3% |
| Immigrants from Albania | 33.8 /100 | #187 | Fair 5.3% |
| Israelis | 33.1 /100 | #188 | Fair 5.3% |
| South American Indians | 32.5 /100 | #189 | Fair 5.3% |
Immigrants from Vietnam Married-Couple Family Poverty Correlation Summary
| Measurement | Immigrants from Vietnam Data | Married-Couple Family Poverty Data |
| Minimum | 0.12% | 0.96% |
| Maximum | 31.6% | 13.2% |
| Range | 31.4% | 12.3% |
| Mean | 10.7% | 6.1% |
| Median | 8.5% | 5.7% |
| Interquartile 25% (IQ1) | 4.2% | 4.6% |
| Interquartile 75% (IQ3) | 14.5% | 7.4% |
| Interquartile Range (IQR) | 10.3% | 2.8% |
| Standard Deviation (Sample) | 8.5% | 2.4% |
| Standard Deviation (Population) | 8.4% | 2.4% |
Correlation Details
| Immigrants from Vietnam Percentile | Sample Size | Married-Couple Family Poverty |
[ 0.0% - 0.5% ] 0.12% | 203,067,469 | 5.2% |
[ 0.0% - 0.5% ] 0.37% | 84,595,996 | 4.8% |
[ 0.5% - 1.0% ] 0.64% | 40,266,924 | 4.6% |
[ 0.5% - 1.0% ] 0.90% | 18,255,022 | 4.3% |
[ 1.0% - 1.5% ] 1.18% | 15,981,857 | 5.1% |
[ 1.0% - 1.5% ] 1.43% | 7,098,468 | 4.6% |
[ 1.5% - 2.0% ] 1.72% | 9,002,032 | 4.4% |
[ 1.5% - 2.0% ] 1.97% | 3,968,286 | 4.3% |
[ 2.0% - 2.5% ] 2.20% | 3,062,245 | 4.9% |
[ 2.0% - 2.5% ] 2.46% | 2,388,201 | 5.4% |
[ 2.5% - 3.0% ] 2.73% | 1,479,898 | 5.0% |
[ 3.0% - 3.5% ] 3.00% | 1,410,666 | 5.4% |
[ 3.0% - 3.5% ] 3.28% | 1,202,846 | 5.1% |
[ 3.0% - 3.5% ] 3.50% | 945,771 | 6.2% |
[ 3.5% - 4.0% ] 3.77% | 661,300 | 4.8% |
[ 4.0% - 4.5% ] 4.07% | 1,151,760 | 6.4% |
[ 4.0% - 4.5% ] 4.31% | 518,866 | 7.8% |
[ 4.5% - 5.0% ] 4.54% | 312,106 | 5.0% |
[ 4.5% - 5.0% ] 4.83% | 388,587 | 6.7% |
[ 5.0% - 5.5% ] 5.03% | 239,794 | 4.2% |
[ 5.0% - 5.5% ] 5.31% | 476,192 | 6.9% |
[ 5.5% - 6.0% ] 5.62% | 325,873 | 6.1% |
[ 5.5% - 6.0% ] 5.90% | 294,434 | 6.9% |
[ 6.0% - 6.5% ] 6.18% | 334,722 | 6.1% |
[ 6.0% - 6.5% ] 6.29% | 42,330 | 3.7% |
[ 6.5% - 7.0% ] 6.64% | 234,117 | 8.8% |
[ 6.5% - 7.0% ] 6.89% | 92,970 | 6.2% |
[ 7.0% - 7.5% ] 7.21% | 185,946 | 7.0% |
[ 7.0% - 7.5% ] 7.39% | 167,608 | 5.7% |
[ 7.5% - 8.0% ] 7.71% | 114,943 | 7.0% |
[ 7.5% - 8.0% ] 7.96% | 268,764 | 7.2% |
[ 8.0% - 8.5% ] 8.13% | 1,107,074 | 3.6% |
[ 8.5% - 9.0% ] 8.51% | 71,794 | 7.8% |
[ 8.5% - 9.0% ] 8.70% | 805 | 7.7% |
[ 8.5% - 9.0% ] 8.95% | 167,741 | 5.1% |
[ 9.0% - 9.5% ] 9.19% | 158,485 | 2.9% |
[ 9.5% - 10.0% ] 9.55% | 183,803 | 6.3% |
[ 9.5% - 10.0% ] 9.70% | 84,771 | 7.2% |
[ 10.0% - 10.5% ] 10.21% | 61,593 | 6.3% |
[ 10.5% - 11.0% ] 10.54% | 44,528 | 10.5% |
[ 11.0% - 11.5% ] 11.11% | 17,024 | 1.6% |
[ 11.0% - 11.5% ] 11.36% | 20,132 | 3.2% |
[ 11.0% - 11.5% ] 11.48% | 61 | 12.5% |
[ 11.5% - 12.0% ] 11.78% | 74,703 | 8.7% |
[ 12.0% - 12.5% ] 12.45% | 37,340 | 10.6% |
[ 13.0% - 13.5% ] 13.29% | 40,981 | 3.8% |
[ 13.5% - 14.0% ] 13.77% | 31,102 | 7.7% |
[ 13.5% - 14.0% ] 13.95% | 38,271 | 7.6% |
[ 14.0% - 14.5% ] 14.08% | 61,688 | 13.2% |
[ 14.5% - 15.0% ] 14.88% | 142,257 | 3.6% |
[ 16.5% - 17.0% ] 16.59% | 53,476 | 5.4% |
[ 17.0% - 17.5% ] 17.45% | 7,786 | 3.3% |
[ 18.0% - 18.5% ] 18.11% | 113,587 | 5.5% |
[ 18.5% - 19.0% ] 18.62% | 127,330 | 8.8% |
[ 19.0% - 19.5% ] 19.25% | 45,688 | 3.6% |
[ 19.5% - 20.0% ] 19.79% | 859 | 0.96% |
[ 23.0% - 23.5% ] 23.07% | 171,637 | 6.5% |
[ 24.0% - 24.5% ] 24.01% | 2,916 | 6.6% |
[ 24.5% - 25.0% ] 24.66% | 36,657 | 5.1% |
[ 26.5% - 27.0% ] 26.81% | 34,188 | 8.1% |
[ 28.5% - 29.0% ] 28.67% | 593 | 1.6% |
[ 28.5% - 29.0% ] 28.68% | 47,549 | 9.0% |
[ 29.0% - 29.5% ] 29.13% | 16,072 | 10.1% |
[ 30.0% - 30.5% ] 30.26% | 181,268 | 11.0% |
[ 31.5% - 32.0% ] 31.56% | 22,622 | 5.7% |