Immigrants from Thailand Married-Couple Family Poverty

COMPARE

Immigrants from Thailand
Race
Ancestry
AfghanAfricanAlaska NativeAlaskan AthabascanAlbanianAleutAlsatianAmericanApacheArabArapahoArgentineanArmenianAssyrian/Chaldean/SyriacAustralianAustrianBahamianBangladeshiBarbadianBasqueBelgianBelizeanBermudanBhutaneseBlackfeetBolivianBrazilianBritishBritish West IndianBulgarianBurmeseCajunCambodianCanadianCape VerdeanCarpatho RusynCelticCentral AmericanCentral American IndianCherokeeCheyenneChickasawChileanChineseChippewaChoctawColombianColvilleComancheCosta RicanCreeCreekCroatianCrowCubanCypriotCzechCzechoslovakianDanishDelawareDominicanDutchDutch West IndianEastern EuropeanEcuadorianEgyptianEnglishEstonianEthiopianEuropeanFijianFilipinoFinnishFrenchFrench American IndianFrench CanadianGermanGerman RussianGhanaianGreekGuamanian/ChamorroGuatemalanGuyaneseHaitianHmongHonduranHopiHoumaHungarianIcelanderIndian (Asian)IndonesianInupiatIranianIraqiIrishIroquoisIsraeliItalianJamaicanJapaneseJordanianKenyanKiowaKoreanLaotianLatvianLebaneseLiberianLithuanianLumbeeLuxembourgerMacedonianMalaysianMalteseMarshalleseMenomineeMexicanMexican American IndianMongolianMoroccanNative HawaiianNavajoNepaleseNew ZealanderNicaraguanNigerianNorthern EuropeanNorwegianOkinawanOsageOttawaPaiutePakistaniPalestinianPanamanianParaguayanPennsylvania GermanPeruvianPimaPolishPortuguesePotawatomiPuebloPuerto RicanPuget Sound SalishRomanianRussianSalvadoranSamoanScandinavianScotch-IrishScottishSeminoleSenegaleseSerbianShoshoneSierra LeoneanSiouxSlavicSlovakSloveneSomaliSouth AfricanSouth AmericanSouth American IndianSoviet UnionSpaniardSpanishSpanish AmericanSpanish American IndianSri LankanSubsaharan AfricanSudaneseSwedishSwissSyrianTaiwaneseThaiTlingit-HaidaTohono O'OdhamTonganTrinidadian and TobagonianTsimshianTurkishU.S. Virgin IslanderUgandanUkrainianUruguayanUteVenezuelanVietnameseWelshWest IndianYakamaYaquiYugoslavianYumanYup'ikZimbabwean
Immigration
NonimmigrantsImmigrantsAfghanistanAfricaAlbaniaArgentinaArmeniaAsiaAustraliaAustriaBahamasBangladeshBarbadosBelarusBelgiumBelizeBoliviaBosnia and HerzegovinaBrazilBulgariaBurma/MyanmarCabo VerdeCambodiaCameroonCanadaCaribbeanCentral AmericaChileChinaColombiaCongoCosta RicaCroatiaCubaCzechoslovakiaDenmarkDominicaDominican RepublicEastern AfricaEastern AsiaEastern EuropeEcuadorEgyptEl SalvadorEnglandEritreaEthiopiaEuropeFijiFranceGermanyGhanaGreeceGrenadaGuatemalaGuyanaHaitiHondurasHong KongHungaryIndiaIndonesiaIranIraqIrelandIsraelItalyJamaicaJapanJordanKazakhstanKenyaKoreaKuwaitLaosLatin AmericaLatviaLebanonLiberiaLithuaniaMalaysiaMexicoMicronesiaMiddle AfricaMoldovaMoroccoNepalNetherlandsNicaraguaNigeriaNorth AmericaNorth MacedoniaNorthern AfricaNorthern EuropeNorwayOceaniaPakistanPanamaPeruPhilippinesPolandPortugalRomaniaRussiaSaudi ArabiaScotlandSenegalSerbiaSierra LeoneSingaporeSomaliaSouth AfricaSouth AmericaSouth Central AsiaSouth Eastern AsiaSouthern EuropeSpainSri LankaSt. Vincent and the GrenadinesSudanSwedenSwitzerlandSyriaTaiwanThailandTrinidad and TobagoTurkeyUgandaUkraineUruguayUzbekistanVenezuelaVietnamWest IndiesWestern AfricaWestern AsiaWestern EuropeYemenZaireZimbabweAzores
Select to Compare
Race
Ancestry
AfghanAfricanAlaska NativeAlaskan AthabascanAlbanianAleutAlsatianAmericanApacheArabArapahoArgentineanArmenianAssyrian/Chaldean/SyriacAustralianAustrianBahamianBangladeshiBarbadianBasqueBelgianBelizeanBermudanBhutaneseBlackfeetBolivianBrazilianBritishBritish West IndianBulgarianBurmeseCajunCambodianCanadianCape VerdeanCarpatho RusynCelticCentral AmericanCentral American IndianCherokeeCheyenneChickasawChileanChineseChippewaChoctawColombianColvilleComancheCosta RicanCreeCreekCroatianCrowCubanCypriotCzechCzechoslovakianDanishDelawareDominicanDutchDutch West IndianEastern EuropeanEcuadorianEgyptianEnglishEstonianEthiopianEuropeanFijianFilipinoFinnishFrenchFrench American IndianFrench CanadianGermanGerman RussianGhanaianGreekGuamanian/ChamorroGuatemalanGuyaneseHaitianHmongHonduranHopiHoumaHungarianIcelanderIndian (Asian)IndonesianInupiatIranianIraqiIrishIroquoisIsraeliItalianJamaicanJapaneseJordanianKenyanKiowaKoreanLaotianLatvianLebaneseLiberianLithuanianLumbeeLuxembourgerMacedonianMalaysianMalteseMarshalleseMenomineeMexicanMexican American IndianMongolianMoroccanNative HawaiianNavajoNepaleseNew ZealanderNicaraguanNigerianNorthern EuropeanNorwegianOkinawanOsageOttawaPaiutePakistaniPalestinianPanamanianParaguayanPennsylvania GermanPeruvianPimaPolishPortuguesePotawatomiPuebloPuerto RicanPuget Sound SalishRomanianRussianSalvadoranSamoanScandinavianScotch-IrishScottishSeminoleSenegaleseSerbianShoshoneSierra LeoneanSiouxSlavicSlovakSloveneSomaliSouth AfricanSouth AmericanSouth American IndianSoviet UnionSpaniardSpanishSpanish AmericanSpanish American IndianSri LankanSubsaharan AfricanSudaneseSwedishSwissSyrianTaiwaneseThaiTlingit-HaidaTohono O'OdhamTonganTrinidadian and TobagonianTsimshianTurkishU.S. Virgin IslanderUgandanUkrainianUruguayanUteVenezuelanVietnameseWelshWest IndianYakamaYaquiYugoslavianYumanYup'ikZimbabwean
Immigration
NonimmigrantsImmigrantsAfghanistanAfricaAlbaniaArgentinaArmeniaAsiaAustraliaAustriaBahamasBangladeshBarbadosBelarusBelgiumBelizeBoliviaBosnia and HerzegovinaBrazilBulgariaBurma/MyanmarCabo VerdeCambodiaCameroonCanadaCaribbeanCentral AmericaChileChinaColombiaCongoCosta RicaCroatiaCubaCzechoslovakiaDenmarkDominicaDominican RepublicEastern AfricaEastern AsiaEastern EuropeEcuadorEgyptEl SalvadorEnglandEritreaEthiopiaEuropeFijiFranceGermanyGhanaGreeceGrenadaGuatemalaGuyanaHaitiHondurasHong KongHungaryIndiaIndonesiaIranIraqIrelandIsraelItalyJamaicaJapanJordanKazakhstanKenyaKoreaKuwaitLaosLatin AmericaLatviaLebanonLiberiaLithuaniaMalaysiaMexicoMicronesiaMiddle AfricaMoldovaMoroccoNepalNetherlandsNicaraguaNigeriaNorth AmericaNorth MacedoniaNorthern AfricaNorthern EuropeNorwayOceaniaPakistanPanamaPeruPhilippinesPolandPortugalRomaniaRussiaSaudi ArabiaScotlandSenegalSerbiaSierra LeoneSingaporeSomaliaSouth AfricaSouth AmericaSouth Central AsiaSouth Eastern AsiaSouthern EuropeSpainSri LankaSt. Vincent and the GrenadinesSudanSwedenSwitzerlandSyriaTaiwanTrinidad and TobagoTurkeyUgandaUkraineUruguayUzbekistanVenezuelaVietnamWest IndiesWestern AfricaWestern AsiaWestern EuropeYemenZaireZimbabweAzores
Married-Couple Family Poverty
Income
Poverty
Unemployment
Labor Participation
Family Structure
Vehicle Availability
Education Level
Disability

Immigrants from Thailand Married-Couple Family Poverty
Poor

5.5%
POVERTY | MARRIED-COUPLE FAMILIES
14.0/ 100
METRIC RATING
212th/ 347
METRIC RANK

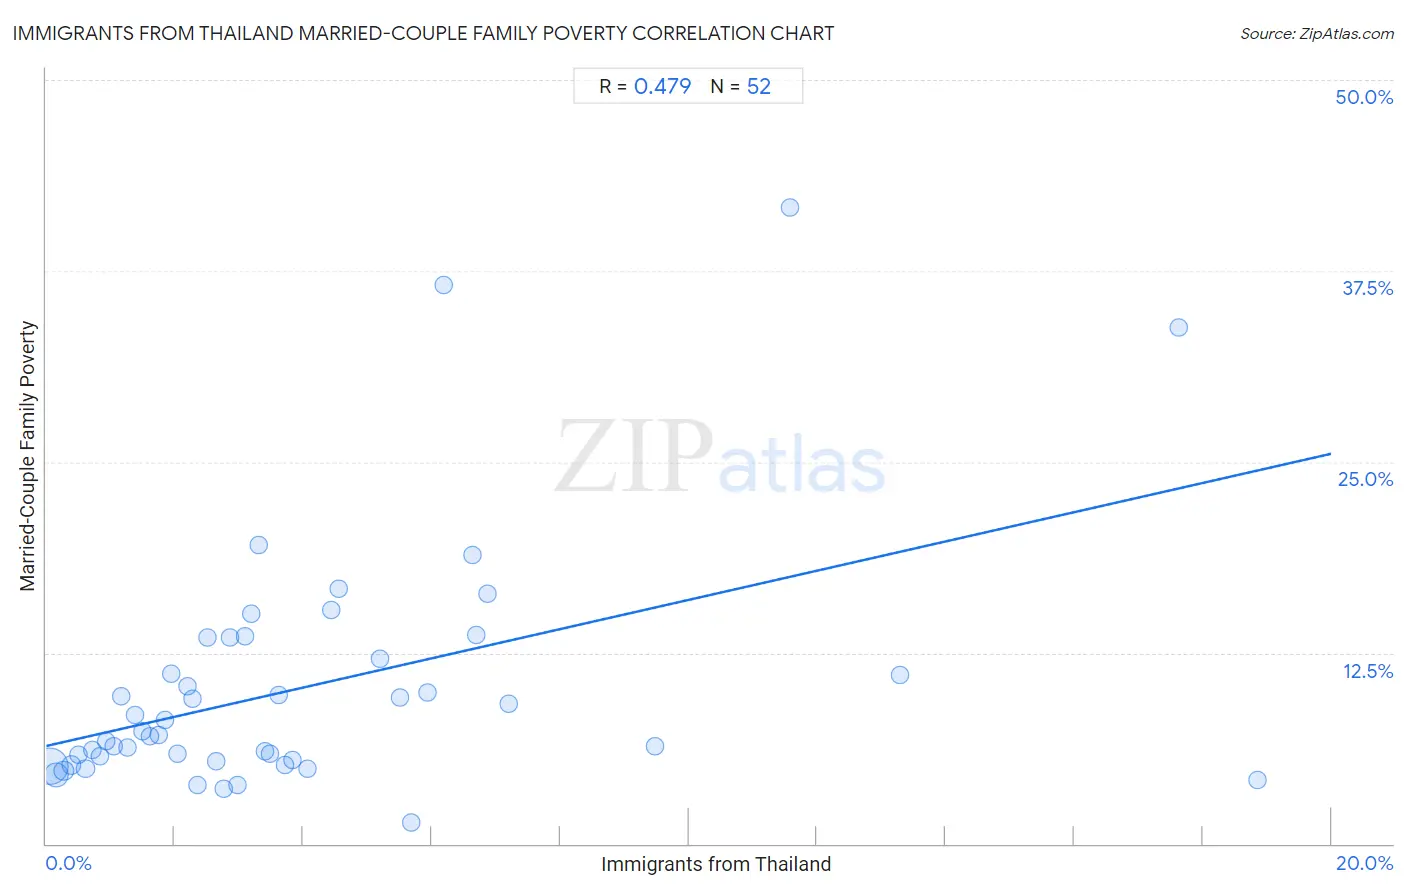
Immigrants from Thailand Married-Couple Family Poverty Correlation Chart

The statistical analysis conducted on geographies consisting of 315,183,540 people shows a moderate positive correlation between the proportion of Immigrants from Thailand and poverty level among married-couple families in the United States with a correlation coefficient (R) of 0.479 and weighted average of 5.5%. On average, for every 1% (one percent) increase in Immigrants from Thailand within a typical geography, there is an increase of 0.96% in poverty level among married-couple families.
Immigrants from Thailand Married-Couple Family Poverty
It is essential to understand that the correlation between the percentage of Immigrants from Thailand and poverty level among married-couple families does not imply a direct cause-and-effect relationship. It remains uncertain whether the presence of Immigrants from Thailand influences an upward or downward trend in the level of poverty level among married-couple families within an area, or if Immigrants from Thailand simply ended up residing in those areas with higher or lower levels of poverty level among married-couple families due to other factors.

Demographics Similar to Immigrants from Thailand by Married-Couple Family Poverty

In terms of married-couple family poverty, the demographic groups most similar to Immigrants from Thailand are Nigerian (5.5%, a difference of 0.070%), Immigrants from Micronesia (5.5%, a difference of 0.090%), Immigrants from Liberia (5.5%, a difference of 0.18%), Iroquois (5.5%, a difference of 0.22%), and Armenian (5.5%, a difference of 0.29%).
DemographicsRating | RankMarried-Couple Family Poverty
Chippewa
18.9
/100
|
#205
Poor
5.4%
Osage
18.4
/100
|
#206
Poor
5.4%
Immigrants from Africa
17.6
/100
|
#207
Poor
5.5%
French American Indians
16.1
/100
|
#208
Poor
5.5%
Immigrants from Syria
15.4
/100
|
#209
Poor
5.5%
Immigrants from Micronesia
14.4
/100
|
#210
Poor
5.5%
Nigerians
14.3
/100
|
#211
Poor
5.5%
Immigrants from Thailand
14.0
/100
|
#212
Poor
5.5%
Immigrants from Liberia
13.3
/100
|
#213
Poor
5.5%
Iroquois
13.1
/100
|
#214
Poor
5.5%
Armenians
12.8
/100
|
#215
Poor
5.5%
Potawatomi
12.4
/100
|
#216
Poor
5.5%
Immigrants from Nigeria
11.3
/100
|
#217
Poor
5.5%
Afghans
11.2
/100
|
#218
Poor
5.5%
Japanese
9.8
/100
|
#219
Tragic
5.6%

Immigrants from Thailand Married-Couple Family Poverty Correlation Summary

MeasurementImmigrants from Thailand DataMarried-Couple Family Poverty Data
Minimum0.054%1.4%
Maximum18.8%41.7%
Range18.8%40.3%
Mean4.0%10.2%
Median2.9%7.2%
Interquartile 25% (IQ1)1.4%5.5%
Interquartile 75% (IQ3)5.4%12.8%
Interquartile Range (IQR)3.9%7.3%
Standard Deviation (Sample)4.0%8.0%
Standard Deviation (Population)4.0%7.9%

Correlation Details

Immigrants from Thailand PercentileSample SizeMarried-Couple Family Poverty
[
0.0%
-
0.5%
]
0.054%
196,538,9395.0%
[
0.0%
-
0.5%
]
0.16%
66,080,9664.5%
[
0.0%
-
0.5%
]
0.27%
23,399,7304.8%
[
0.0%
-
0.5%
]
0.38%
11,766,3435.1%
[
0.0%
-
0.5%
]
0.50%
5,970,9185.8%
[
0.5%
-
1.0%
]
0.61%
3,033,0474.9%
[
0.5%
-
1.0%
]
0.72%
2,310,1786.1%
[
0.5%
-
1.0%
]
0.83%
1,115,5855.7%
[
0.5%
-
1.0%
]
0.94%
655,0476.7%
[
1.0%
-
1.5%
]
1.06%
821,3686.4%
[
1.0%
-
1.5%
]
1.16%
467,2359.7%
[
1.0%
-
1.5%
]
1.27%
351,6806.3%
[
1.0%
-
1.5%
]
1.39%
503,2248.5%
[
1.5%
-
2.0%
]
1.51%
438,2827.4%
[
1.5%
-
2.0%
]
1.61%
182,1637.0%
[
1.5%
-
2.0%
]
1.76%
240,0337.1%
[
1.5%
-
2.0%
]
1.84%
103,2188.1%
[
1.5%
-
2.0%
]
1.95%
67,82511.1%
[
2.0%
-
2.5%
]
2.04%
165,0375.9%
[
2.0%
-
2.5%
]
2.19%
124,13710.3%
[
2.0%
-
2.5%
]
2.27%
86,9509.5%
[
2.0%
-
2.5%
]
2.35%
18,7353.8%
[
2.5%
-
3.0%
]
2.51%
13,79913.5%
[
2.5%
-
3.0%
]
2.65%
317,5015.4%
[
2.5%
-
3.0%
]
2.76%
22,3083.6%
[
2.5%
-
3.0%
]
2.85%
46,15313.5%
[
2.5%
-
3.0%
]
2.97%
61,1683.8%
[
3.0%
-
3.5%
]
3.08%
44,79913.6%
[
3.0%
-
3.5%
]
3.18%
1,41415.1%
[
3.0%
-
3.5%
]
3.30%
15,98919.6%
[
3.0%
-
3.5%
]
3.40%
1,1176.1%
[
3.0%
-
3.5%
]
3.49%
85,4785.9%
[
3.5%
-
4.0%
]
3.63%
17,0089.8%
[
3.5%
-
4.0%
]
3.71%
6,0655.1%
[
3.5%
-
4.0%
]
3.83%
3,4965.5%
[
4.0%
-
4.5%
]
4.06%
4685.0%
[
4.0%
-
4.5%
]
4.44%
54015.3%
[
4.5%
-
5.0%
]
4.55%
8816.7%
[
5.0%
-
5.5%
]
5.19%
28912.1%
[
5.5%
-
6.0%
]
5.51%
3999.6%
[
5.5%
-
6.0%
]
5.69%
8791.4%
[
5.5%
-
6.0%
]
5.93%
57,8149.9%
[
6.0%
-
6.5%
]
6.19%
92136.6%
[
6.5%
-
7.0%
]
6.63%
19,61318.9%
[
6.5%
-
7.0%
]
6.70%
19,50113.7%
[
6.5%
-
7.0%
]
6.87%
26216.4%
[
7.0%
-
7.5%
]
7.20%
2,3329.1%
[
9.0%
-
9.5%
]
9.47%
1,0356.3%
[
11.5%
-
12.0%
]
11.57%
1,13241.7%
[
13.0%
-
13.5%
]
13.28%
73811.0%
[
17.5%
-
18.0%
]
17.62%
40333.8%
[
18.5%
-
19.0%
]
18.85%
1914.2%