Chickasaw vs Estonian Married-Couple Family Poverty
COMPARE
Chickasaw
Estonian
Married-Couple Family Poverty
Married-Couple Family Poverty Comparison
Chickasaw
Estonians
5.8%
MARRIED-COUPLE FAMILY POVERTY
2.3/ 100
METRIC RATING
244th/ 347
METRIC RANK
4.2%
MARRIED-COUPLE FAMILY POVERTY
99.9/ 100
METRIC RATING
31st/ 347
METRIC RANK
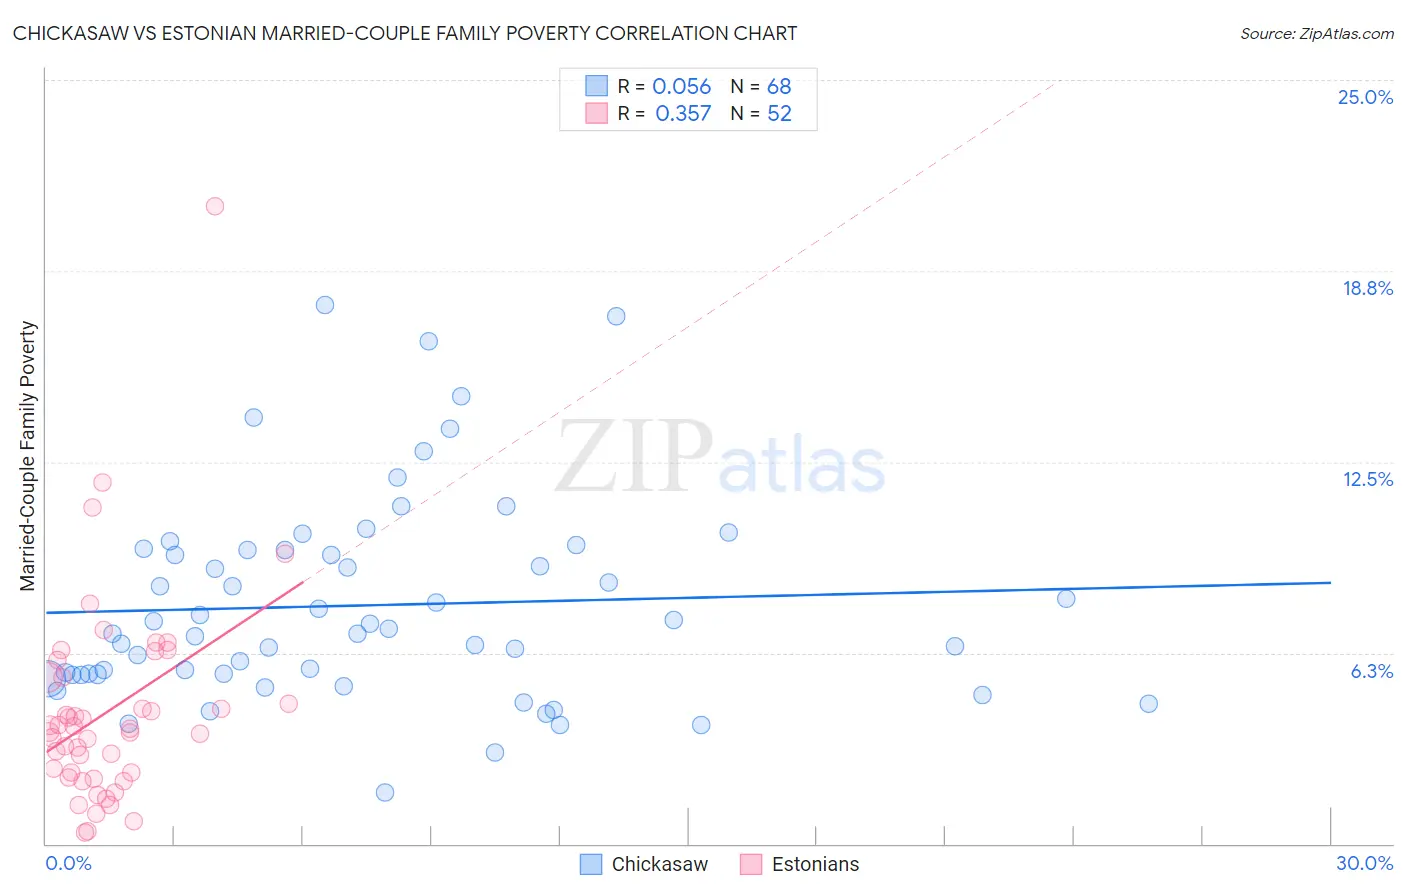
Chickasaw vs Estonian Married-Couple Family Poverty Correlation Chart
The statistical analysis conducted on geographies consisting of 147,342,221 people shows a slight positive correlation between the proportion of Chickasaw and poverty level among married-couple families in the United States with a correlation coefficient (R) of 0.056 and weighted average of 5.8%. Similarly, the statistical analysis conducted on geographies consisting of 123,069,874 people shows a mild positive correlation between the proportion of Estonians and poverty level among married-couple families in the United States with a correlation coefficient (R) of 0.357 and weighted average of 4.2%, a difference of 39.1%.
Married-Couple Family Poverty Correlation Summary
| Measurement | Chickasaw | Estonian |
| Minimum | 1.7% | 0.39% |
| Maximum | 17.6% | 20.8% |
| Range | 16.0% | 20.5% |
| Mean | 7.8% | 4.3% |
| Median | 7.0% | 3.7% |
| Interquartile 25% (IQ1) | 5.5% | 2.2% |
| Interquartile 75% (IQ3) | 9.6% | 5.4% |
| Interquartile Range (IQR) | 4.1% | 3.2% |
| Standard Deviation (Sample) | 3.4% | 3.4% |
| Standard Deviation (Population) | 3.3% | 3.4% |
Similar Demographics by Married-Couple Family Poverty
Demographics Similar to Chickasaw by Married-Couple Family Poverty
In terms of married-couple family poverty, the demographic groups most similar to Chickasaw are Somali (5.8%, a difference of 0.010%), Immigrants from Afghanistan (5.8%, a difference of 0.15%), Immigrants from Western Africa (5.8%, a difference of 0.17%), Immigrants from Panama (5.8%, a difference of 0.26%), and Fijian (5.8%, a difference of 0.28%).
| Demographics | Rating | Rank | Married-Couple Family Poverty |
| Immigrants | South America | 3.1 /100 | #237 | Tragic 5.7% |
| Cherokee | 2.7 /100 | #238 | Tragic 5.8% |
| Venezuelans | 2.7 /100 | #239 | Tragic 5.8% |
| Fijians | 2.5 /100 | #240 | Tragic 5.8% |
| Immigrants | Panama | 2.5 /100 | #241 | Tragic 5.8% |
| Immigrants | Western Africa | 2.4 /100 | #242 | Tragic 5.8% |
| Somalis | 2.3 /100 | #243 | Tragic 5.8% |
| Chickasaw | 2.3 /100 | #244 | Tragic 5.8% |
| Immigrants | Afghanistan | 2.1 /100 | #245 | Tragic 5.8% |
| Immigrants | Venezuela | 1.8 /100 | #246 | Tragic 5.8% |
| Iraqis | 1.4 /100 | #247 | Tragic 5.9% |
| Cree | 1.2 /100 | #248 | Tragic 5.9% |
| Tsimshian | 1.1 /100 | #249 | Tragic 5.9% |
| Immigrants | Eritrea | 1.1 /100 | #250 | Tragic 5.9% |
| Immigrants | Ghana | 1.0 /100 | #251 | Tragic 5.9% |
Demographics Similar to Estonians by Married-Couple Family Poverty
In terms of married-couple family poverty, the demographic groups most similar to Estonians are Finnish (4.2%, a difference of 0.080%), Greek (4.2%, a difference of 0.11%), Immigrants from Scotland (4.2%, a difference of 0.32%), Scandinavian (4.1%, a difference of 0.36%), and Danish (4.1%, a difference of 0.47%).
| Demographics | Rating | Rank | Married-Couple Family Poverty |
| Eastern Europeans | 99.9 /100 | #24 | Exceptional 4.1% |
| Immigrants | Taiwan | 99.9 /100 | #25 | Exceptional 4.1% |
| Cypriots | 99.9 /100 | #26 | Exceptional 4.1% |
| Danes | 99.9 /100 | #27 | Exceptional 4.1% |
| Scandinavians | 99.9 /100 | #28 | Exceptional 4.1% |
| Immigrants | Scotland | 99.9 /100 | #29 | Exceptional 4.2% |
| Finns | 99.9 /100 | #30 | Exceptional 4.2% |
| Estonians | 99.9 /100 | #31 | Exceptional 4.2% |
| Greeks | 99.9 /100 | #32 | Exceptional 4.2% |
| Irish | 99.9 /100 | #33 | Exceptional 4.2% |
| Dutch | 99.9 /100 | #34 | Exceptional 4.2% |
| Europeans | 99.9 /100 | #35 | Exceptional 4.2% |
| English | 99.9 /100 | #36 | Exceptional 4.2% |
| Iranians | 99.9 /100 | #37 | Exceptional 4.2% |
| Belgians | 99.9 /100 | #38 | Exceptional 4.2% |