Immigrants from Eastern Europe Married-Couple Family Poverty

COMPARE

Immigrants from Eastern Europe
Race
Ancestry
AfghanAfricanAlaska NativeAlaskan AthabascanAlbanianAleutAlsatianAmericanApacheArabArapahoArgentineanArmenianAssyrian/Chaldean/SyriacAustralianAustrianBahamianBangladeshiBarbadianBasqueBelgianBelizeanBermudanBhutaneseBlackfeetBolivianBrazilianBritishBritish West IndianBulgarianBurmeseCajunCambodianCanadianCape VerdeanCarpatho RusynCelticCentral AmericanCentral American IndianCherokeeCheyenneChickasawChileanChineseChippewaChoctawColombianColvilleComancheCosta RicanCreeCreekCroatianCrowCubanCypriotCzechCzechoslovakianDanishDelawareDominicanDutchDutch West IndianEastern EuropeanEcuadorianEgyptianEnglishEstonianEthiopianEuropeanFijianFilipinoFinnishFrenchFrench American IndianFrench CanadianGermanGerman RussianGhanaianGreekGuamanian/ChamorroGuatemalanGuyaneseHaitianHmongHonduranHopiHoumaHungarianIcelanderIndian (Asian)IndonesianInupiatIranianIraqiIrishIroquoisIsraeliItalianJamaicanJapaneseJordanianKenyanKiowaKoreanLaotianLatvianLebaneseLiberianLithuanianLumbeeLuxembourgerMacedonianMalaysianMalteseMarshalleseMenomineeMexicanMexican American IndianMongolianMoroccanNative HawaiianNavajoNepaleseNew ZealanderNicaraguanNigerianNorthern EuropeanNorwegianOkinawanOsageOttawaPaiutePakistaniPalestinianPanamanianParaguayanPennsylvania GermanPeruvianPimaPolishPortuguesePotawatomiPuebloPuerto RicanPuget Sound SalishRomanianRussianSalvadoranSamoanScandinavianScotch-IrishScottishSeminoleSenegaleseSerbianShoshoneSierra LeoneanSiouxSlavicSlovakSloveneSomaliSouth AfricanSouth AmericanSouth American IndianSoviet UnionSpaniardSpanishSpanish AmericanSpanish American IndianSri LankanSubsaharan AfricanSudaneseSwedishSwissSyrianTaiwaneseThaiTlingit-HaidaTohono O'OdhamTonganTrinidadian and TobagonianTsimshianTurkishU.S. Virgin IslanderUgandanUkrainianUruguayanUteVenezuelanVietnameseWelshWest IndianYakamaYaquiYugoslavianYumanYup'ikZimbabwean
Immigration
NonimmigrantsImmigrantsAfghanistanAfricaAlbaniaArgentinaArmeniaAsiaAustraliaAustriaBahamasBangladeshBarbadosBelarusBelgiumBelizeBoliviaBosnia and HerzegovinaBrazilBulgariaBurma/MyanmarCabo VerdeCambodiaCameroonCanadaCaribbeanCentral AmericaChileChinaColombiaCongoCosta RicaCroatiaCubaCzechoslovakiaDenmarkDominicaDominican RepublicEastern AfricaEastern AsiaEastern EuropeEcuadorEgyptEl SalvadorEnglandEritreaEthiopiaEuropeFijiFranceGermanyGhanaGreeceGrenadaGuatemalaGuyanaHaitiHondurasHong KongHungaryIndiaIndonesiaIranIraqIrelandIsraelItalyJamaicaJapanJordanKazakhstanKenyaKoreaKuwaitLaosLatin AmericaLatviaLebanonLiberiaLithuaniaMalaysiaMexicoMicronesiaMiddle AfricaMoldovaMoroccoNepalNetherlandsNicaraguaNigeriaNorth AmericaNorth MacedoniaNorthern AfricaNorthern EuropeNorwayOceaniaPakistanPanamaPeruPhilippinesPolandPortugalRomaniaRussiaSaudi ArabiaScotlandSenegalSerbiaSierra LeoneSingaporeSomaliaSouth AfricaSouth AmericaSouth Central AsiaSouth Eastern AsiaSouthern EuropeSpainSri LankaSt. Vincent and the GrenadinesSudanSwedenSwitzerlandSyriaTaiwanThailandTrinidad and TobagoTurkeyUgandaUkraineUruguayUzbekistanVenezuelaVietnamWest IndiesWestern AfricaWestern AsiaWestern EuropeYemenZaireZimbabweAzores
Select to Compare
Race
Ancestry
AfghanAfricanAlaska NativeAlaskan AthabascanAlbanianAleutAlsatianAmericanApacheArabArapahoArgentineanArmenianAssyrian/Chaldean/SyriacAustralianAustrianBahamianBangladeshiBarbadianBasqueBelgianBelizeanBermudanBhutaneseBlackfeetBolivianBrazilianBritishBritish West IndianBulgarianBurmeseCajunCambodianCanadianCape VerdeanCarpatho RusynCelticCentral AmericanCentral American IndianCherokeeCheyenneChickasawChileanChineseChippewaChoctawColombianColvilleComancheCosta RicanCreeCreekCroatianCrowCubanCypriotCzechCzechoslovakianDanishDelawareDominicanDutchDutch West IndianEastern EuropeanEcuadorianEgyptianEnglishEstonianEthiopianEuropeanFijianFilipinoFinnishFrenchFrench American IndianFrench CanadianGermanGerman RussianGhanaianGreekGuamanian/ChamorroGuatemalanGuyaneseHaitianHmongHonduranHopiHoumaHungarianIcelanderIndian (Asian)IndonesianInupiatIranianIraqiIrishIroquoisIsraeliItalianJamaicanJapaneseJordanianKenyanKiowaKoreanLaotianLatvianLebaneseLiberianLithuanianLumbeeLuxembourgerMacedonianMalaysianMalteseMarshalleseMenomineeMexicanMexican American IndianMongolianMoroccanNative HawaiianNavajoNepaleseNew ZealanderNicaraguanNigerianNorthern EuropeanNorwegianOkinawanOsageOttawaPaiutePakistaniPalestinianPanamanianParaguayanPennsylvania GermanPeruvianPimaPolishPortuguesePotawatomiPuebloPuerto RicanPuget Sound SalishRomanianRussianSalvadoranSamoanScandinavianScotch-IrishScottishSeminoleSenegaleseSerbianShoshoneSierra LeoneanSiouxSlavicSlovakSloveneSomaliSouth AfricanSouth AmericanSouth American IndianSoviet UnionSpaniardSpanishSpanish AmericanSpanish American IndianSri LankanSubsaharan AfricanSudaneseSwedishSwissSyrianTaiwaneseThaiTlingit-HaidaTohono O'OdhamTonganTrinidadian and TobagonianTsimshianTurkishU.S. Virgin IslanderUgandanUkrainianUruguayanUteVenezuelanVietnameseWelshWest IndianYakamaYaquiYugoslavianYumanYup'ikZimbabwean
Immigration
NonimmigrantsImmigrantsAfghanistanAfricaAlbaniaArgentinaArmeniaAsiaAustraliaAustriaBahamasBangladeshBarbadosBelarusBelgiumBelizeBoliviaBosnia and HerzegovinaBrazilBulgariaBurma/MyanmarCabo VerdeCambodiaCameroonCanadaCaribbeanCentral AmericaChileChinaColombiaCongoCosta RicaCroatiaCubaCzechoslovakiaDenmarkDominicaDominican RepublicEastern AfricaEastern AsiaEcuadorEgyptEl SalvadorEnglandEritreaEthiopiaEuropeFijiFranceGermanyGhanaGreeceGrenadaGuatemalaGuyanaHaitiHondurasHong KongHungaryIndiaIndonesiaIranIraqIrelandIsraelItalyJamaicaJapanJordanKazakhstanKenyaKoreaKuwaitLaosLatin AmericaLatviaLebanonLiberiaLithuaniaMalaysiaMexicoMicronesiaMiddle AfricaMoldovaMoroccoNepalNetherlandsNicaraguaNigeriaNorth AmericaNorth MacedoniaNorthern AfricaNorthern EuropeNorwayOceaniaPakistanPanamaPeruPhilippinesPolandPortugalRomaniaRussiaSaudi ArabiaScotlandSenegalSerbiaSierra LeoneSingaporeSomaliaSouth AfricaSouth AmericaSouth Central AsiaSouth Eastern AsiaSouthern EuropeSpainSri LankaSt. Vincent and the GrenadinesSudanSwedenSwitzerlandSyriaTaiwanThailandTrinidad and TobagoTurkeyUgandaUkraineUruguayUzbekistanVenezuelaVietnamWest IndiesWestern AfricaWestern AsiaWestern EuropeYemenZaireZimbabweAzores
Married-Couple Family Poverty
Income
Poverty
Unemployment
Labor Participation
Family Structure
Vehicle Availability
Education Level
Disability

Immigrants from Eastern Europe Married-Couple Family Poverty
Exceptional

4.9%
POVERTY | MARRIED-COUPLE FAMILIES
90.5/ 100
METRIC RATING
131st/ 347
METRIC RANK

Immigrants from Eastern Europe Married-Couple Family Poverty Correlation Chart

The statistical analysis conducted on geographies consisting of 468,584,745 people shows a weak positive correlation between the proportion of Immigrants from Eastern Europe and poverty level among married-couple families in the United States with a correlation coefficient (R) of 0.229 and weighted average of 4.9%. On average, for every 1% (one percent) increase in Immigrants from Eastern Europe within a typical geography, there is an increase of 0.077% in poverty level among married-couple families.
Immigrants from Eastern Europe Married-Couple Family Poverty
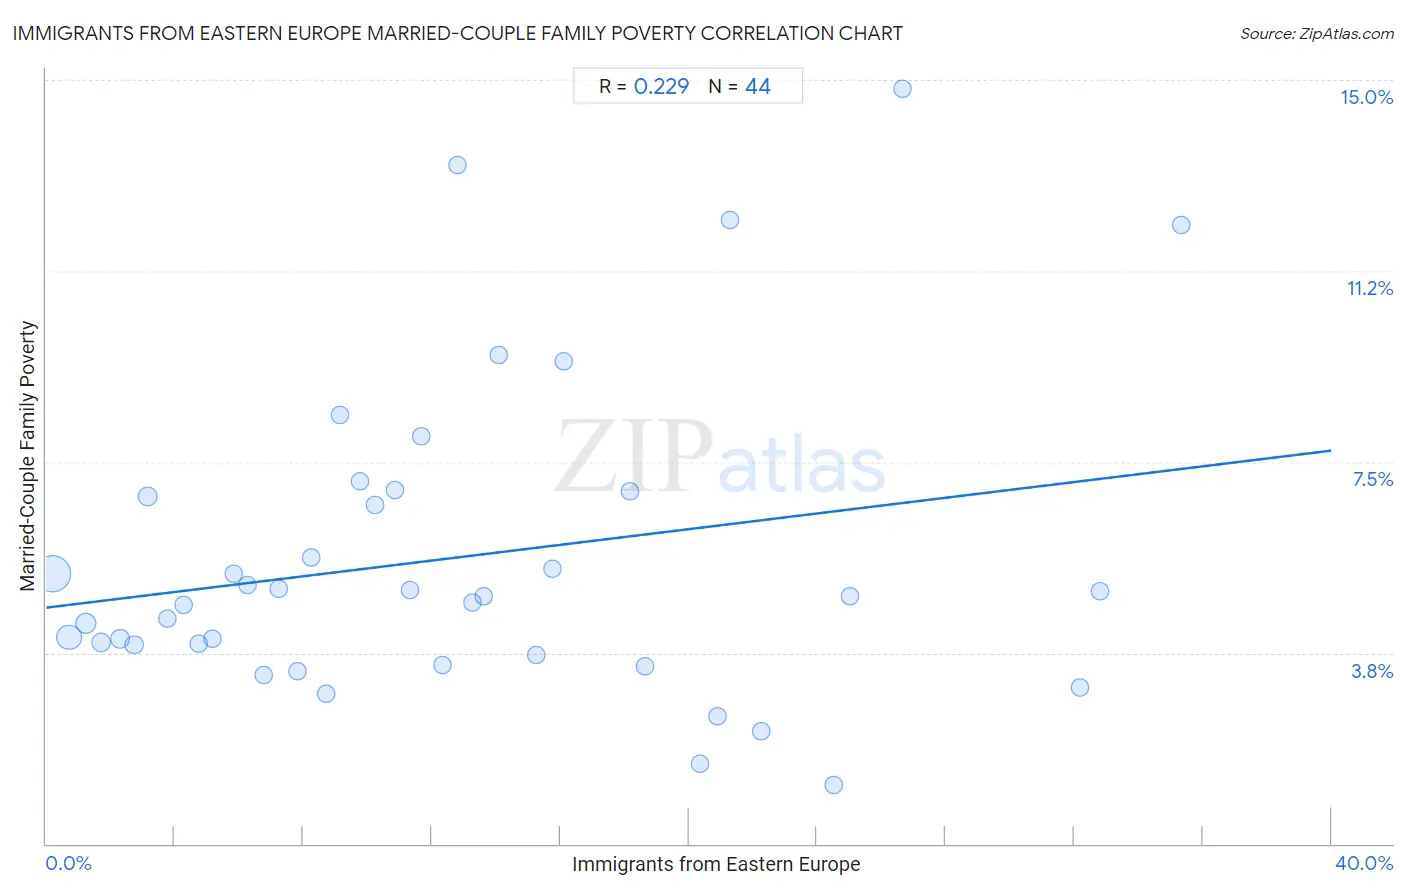
It is essential to understand that the correlation between the percentage of Immigrants from Eastern Europe and poverty level among married-couple families does not imply a direct cause-and-effect relationship. It remains uncertain whether the presence of Immigrants from Eastern Europe influences an upward or downward trend in the level of poverty level among married-couple families within an area, or if Immigrants from Eastern Europe simply ended up residing in those areas with higher or lower levels of poverty level among married-couple families due to other factors.

Demographics Similar to Immigrants from Eastern Europe by Married-Couple Family Poverty

In terms of married-couple family poverty, the demographic groups most similar to Immigrants from Eastern Europe are Puget Sound Salish (4.9%, a difference of 0.010%), Soviet Union (4.9%, a difference of 0.070%), Immigrants from Pakistan (4.9%, a difference of 0.080%), Immigrants from Kenya (4.9%, a difference of 0.090%), and Samoan (4.9%, a difference of 0.090%).
DemographicsRating | RankMarried-Couple Family Poverty
Romanians
92.5
/100
|
#124
Exceptional
4.8%
Immigrants from Bosnia and Herzegovina
92.5
/100
|
#125
Exceptional
4.8%
Immigrants from Asia
92.3
/100
|
#126
Exceptional
4.8%
Egyptians
92.0
/100
|
#127
Exceptional
4.8%
Palestinians
91.2
/100
|
#128
Exceptional
4.9%
Immigrants from Pakistan
90.7
/100
|
#129
Exceptional
4.9%
Soviet Union
90.7
/100
|
#130
Exceptional
4.9%
Immigrants from Eastern Europe
90.5
/100
|
#131
Exceptional
4.9%
Puget Sound Salish
90.4
/100
|
#132
Exceptional
4.9%
Immigrants from Kenya
90.2
/100
|
#133
Exceptional
4.9%
Samoans
90.2
/100
|
#134
Exceptional
4.9%
Assyrians/Chaldeans/Syriacs
89.4
/100
|
#135
Excellent
4.9%
Immigrants from Hungary
88.7
/100
|
#136
Excellent
4.9%
Guamanians/Chamorros
86.5
/100
|
#137
Excellent
4.9%
Chileans
86.0
/100
|
#138
Excellent
4.9%

Immigrants from Eastern Europe Married-Couple Family Poverty Correlation Summary

MeasurementImmigrants from Eastern Europe DataMarried-Couple Family Poverty Data
Minimum0.21%1.2%
Maximum35.3%14.8%
Range35.1%13.7%
Mean12.6%5.6%
Median11.1%4.9%
Interquartile 25% (IQ1)5.5%3.8%
Interquartile 75% (IQ3)18.4%6.9%
Interquartile Range (IQR)12.9%3.1%
Standard Deviation (Sample)9.1%3.1%
Standard Deviation (Population)9.0%3.0%

Correlation Details

Immigrants from Eastern Europe PercentileSample SizeMarried-Couple Family Poverty
[
0.0%
-
0.5%
]
0.21%
260,277,6875.3%
[
0.5%
-
1.0%
]
0.72%
93,692,5354.1%
[
1.0%
-
1.5%
]
1.23%
46,561,5714.3%
[
1.5%
-
2.0%
]
1.73%
20,015,7983.9%
[
2.0%
-
2.5%
]
2.29%
14,531,1504.0%
[
2.5%
-
3.0%
]
2.74%
6,733,9463.9%
[
3.0%
-
3.5%
]
3.16%
12,280,6376.8%
[
3.5%
-
4.0%
]
3.76%
3,361,9774.4%
[
4.0%
-
4.5%
]
4.27%
2,611,0284.7%
[
4.5%
-
5.0%
]
4.74%
1,606,1233.9%
[
5.0%
-
5.5%
]
5.19%
1,028,7274.0%
[
5.5%
-
6.0%
]
5.82%
750,6245.3%
[
6.0%
-
6.5%
]
6.26%
779,9815.1%
[
6.5%
-
7.0%
]
6.76%
438,0253.3%
[
7.0%
-
7.5%
]
7.23%
392,5565.0%
[
7.5%
-
8.0%
]
7.81%
371,1723.4%
[
8.0%
-
8.5%
]
8.24%
369,7695.6%
[
8.5%
-
9.0%
]
8.72%
29,0582.9%
[
9.0%
-
9.5%
]
9.15%
256,5578.4%
[
9.5%
-
10.0%
]
9.76%
247,1857.1%
[
10.0%
-
10.5%
]
10.24%
351,6966.7%
[
10.5%
-
11.0%
]
10.86%
409,5826.9%
[
11.0%
-
11.5%
]
11.33%
133,0925.0%
[
11.5%
-
12.0%
]
11.66%
162,6918.0%
[
12.0%
-
12.5%
]
12.35%
232,9093.5%
[
12.5%
-
13.0%
]
12.81%
106,91513.3%
[
13.0%
-
13.5%
]
13.25%
78,6064.7%
[
13.5%
-
14.0%
]
13.62%
198,5094.9%
[
14.0%
-
14.5%
]
14.08%
45,3189.6%
[
15.0%
-
15.5%
]
15.26%
21,0643.7%
[
15.5%
-
16.0%
]
15.75%
29,5655.4%
[
16.0%
-
16.5%
]
16.13%
151,3139.5%
[
18.0%
-
18.5%
]
18.18%
65,2186.9%
[
18.5%
-
19.0%
]
18.65%
29,1803.5%
[
20.0%
-
20.5%
]
20.33%
1,8641.6%
[
20.5%
-
21.0%
]
20.89%
15,2912.5%
[
21.0%
-
21.5%
]
21.30%
64812.2%
[
22.0%
-
22.5%
]
22.24%
26,4082.2%
[
24.5%
-
25.0%
]
24.50%
8,9421.2%
[
25.0%
-
25.5%
]
25.01%
23,2004.9%
[
26.5%
-
27.0%
]
26.66%
47,89314.8%
[
32.0%
-
32.5%
]
32.16%
1,9903.1%
[
32.5%
-
33.0%
]
32.78%
23,6765.0%
[
35.0%
-
35.5%
]
35.35%
83,06912.1%