Immigrants from Turkey Married-Couple Family Poverty

COMPARE

Immigrants from Turkey
Race
Ancestry
AfghanAfricanAlaska NativeAlaskan AthabascanAlbanianAleutAlsatianAmericanApacheArabArapahoArgentineanArmenianAssyrian/Chaldean/SyriacAustralianAustrianBahamianBangladeshiBarbadianBasqueBelgianBelizeanBermudanBhutaneseBlackfeetBolivianBrazilianBritishBritish West IndianBulgarianBurmeseCajunCambodianCanadianCape VerdeanCarpatho RusynCelticCentral AmericanCentral American IndianCherokeeCheyenneChickasawChileanChineseChippewaChoctawColombianColvilleComancheCosta RicanCreeCreekCroatianCrowCubanCypriotCzechCzechoslovakianDanishDelawareDominicanDutchDutch West IndianEastern EuropeanEcuadorianEgyptianEnglishEstonianEthiopianEuropeanFijianFilipinoFinnishFrenchFrench American IndianFrench CanadianGermanGerman RussianGhanaianGreekGuamanian/ChamorroGuatemalanGuyaneseHaitianHmongHonduranHopiHoumaHungarianIcelanderIndian (Asian)IndonesianInupiatIranianIraqiIrishIroquoisIsraeliItalianJamaicanJapaneseJordanianKenyanKiowaKoreanLaotianLatvianLebaneseLiberianLithuanianLumbeeLuxembourgerMacedonianMalaysianMalteseMarshalleseMenomineeMexicanMexican American IndianMongolianMoroccanNative HawaiianNavajoNepaleseNew ZealanderNicaraguanNigerianNorthern EuropeanNorwegianOkinawanOsageOttawaPaiutePakistaniPalestinianPanamanianParaguayanPennsylvania GermanPeruvianPimaPolishPortuguesePotawatomiPuebloPuerto RicanPuget Sound SalishRomanianRussianSalvadoranSamoanScandinavianScotch-IrishScottishSeminoleSenegaleseSerbianShoshoneSierra LeoneanSiouxSlavicSlovakSloveneSomaliSouth AfricanSouth AmericanSouth American IndianSoviet UnionSpaniardSpanishSpanish AmericanSpanish American IndianSri LankanSubsaharan AfricanSudaneseSwedishSwissSyrianTaiwaneseThaiTlingit-HaidaTohono O'OdhamTonganTrinidadian and TobagonianTsimshianTurkishU.S. Virgin IslanderUgandanUkrainianUruguayanUteVenezuelanVietnameseWelshWest IndianYakamaYaquiYugoslavianYumanYup'ikZimbabwean
Immigration
NonimmigrantsImmigrantsAfghanistanAfricaAlbaniaArgentinaArmeniaAsiaAustraliaAustriaBahamasBangladeshBarbadosBelarusBelgiumBelizeBoliviaBosnia and HerzegovinaBrazilBulgariaBurma/MyanmarCabo VerdeCambodiaCameroonCanadaCaribbeanCentral AmericaChileChinaColombiaCongoCosta RicaCroatiaCubaCzechoslovakiaDenmarkDominicaDominican RepublicEastern AfricaEastern AsiaEastern EuropeEcuadorEgyptEl SalvadorEnglandEritreaEthiopiaEuropeFijiFranceGermanyGhanaGreeceGrenadaGuatemalaGuyanaHaitiHondurasHong KongHungaryIndiaIndonesiaIranIraqIrelandIsraelItalyJamaicaJapanJordanKazakhstanKenyaKoreaKuwaitLaosLatin AmericaLatviaLebanonLiberiaLithuaniaMalaysiaMexicoMicronesiaMiddle AfricaMoldovaMoroccoNepalNetherlandsNicaraguaNigeriaNorth AmericaNorth MacedoniaNorthern AfricaNorthern EuropeNorwayOceaniaPakistanPanamaPeruPhilippinesPolandPortugalRomaniaRussiaSaudi ArabiaScotlandSenegalSerbiaSierra LeoneSingaporeSomaliaSouth AfricaSouth AmericaSouth Central AsiaSouth Eastern AsiaSouthern EuropeSpainSri LankaSt. Vincent and the GrenadinesSudanSwedenSwitzerlandSyriaTaiwanThailandTrinidad and TobagoTurkeyUgandaUkraineUruguayUzbekistanVenezuelaVietnamWest IndiesWestern AfricaWestern AsiaWestern EuropeYemenZaireZimbabweAzores
Select to Compare
Race
Ancestry
AfghanAfricanAlaska NativeAlaskan AthabascanAlbanianAleutAlsatianAmericanApacheArabArapahoArgentineanArmenianAssyrian/Chaldean/SyriacAustralianAustrianBahamianBangladeshiBarbadianBasqueBelgianBelizeanBermudanBhutaneseBlackfeetBolivianBrazilianBritishBritish West IndianBulgarianBurmeseCajunCambodianCanadianCape VerdeanCarpatho RusynCelticCentral AmericanCentral American IndianCherokeeCheyenneChickasawChileanChineseChippewaChoctawColombianColvilleComancheCosta RicanCreeCreekCroatianCrowCubanCypriotCzechCzechoslovakianDanishDelawareDominicanDutchDutch West IndianEastern EuropeanEcuadorianEgyptianEnglishEstonianEthiopianEuropeanFijianFilipinoFinnishFrenchFrench American IndianFrench CanadianGermanGerman RussianGhanaianGreekGuamanian/ChamorroGuatemalanGuyaneseHaitianHmongHonduranHopiHoumaHungarianIcelanderIndian (Asian)IndonesianInupiatIranianIraqiIrishIroquoisIsraeliItalianJamaicanJapaneseJordanianKenyanKiowaKoreanLaotianLatvianLebaneseLiberianLithuanianLumbeeLuxembourgerMacedonianMalaysianMalteseMarshalleseMenomineeMexicanMexican American IndianMongolianMoroccanNative HawaiianNavajoNepaleseNew ZealanderNicaraguanNigerianNorthern EuropeanNorwegianOkinawanOsageOttawaPaiutePakistaniPalestinianPanamanianParaguayanPennsylvania GermanPeruvianPimaPolishPortuguesePotawatomiPuebloPuerto RicanPuget Sound SalishRomanianRussianSalvadoranSamoanScandinavianScotch-IrishScottishSeminoleSenegaleseSerbianShoshoneSierra LeoneanSiouxSlavicSlovakSloveneSomaliSouth AfricanSouth AmericanSouth American IndianSoviet UnionSpaniardSpanishSpanish AmericanSpanish American IndianSri LankanSubsaharan AfricanSudaneseSwedishSwissSyrianTaiwaneseThaiTlingit-HaidaTohono O'OdhamTonganTrinidadian and TobagonianTsimshianTurkishU.S. Virgin IslanderUgandanUkrainianUruguayanUteVenezuelanVietnameseWelshWest IndianYakamaYaquiYugoslavianYumanYup'ikZimbabwean
Immigration
NonimmigrantsImmigrantsAfghanistanAfricaAlbaniaArgentinaArmeniaAsiaAustraliaAustriaBahamasBangladeshBarbadosBelarusBelgiumBelizeBoliviaBosnia and HerzegovinaBrazilBulgariaBurma/MyanmarCabo VerdeCambodiaCameroonCanadaCaribbeanCentral AmericaChileChinaColombiaCongoCosta RicaCroatiaCubaCzechoslovakiaDenmarkDominicaDominican RepublicEastern AfricaEastern AsiaEastern EuropeEcuadorEgyptEl SalvadorEnglandEritreaEthiopiaEuropeFijiFranceGermanyGhanaGreeceGrenadaGuatemalaGuyanaHaitiHondurasHong KongHungaryIndiaIndonesiaIranIraqIrelandIsraelItalyJamaicaJapanJordanKazakhstanKenyaKoreaKuwaitLaosLatin AmericaLatviaLebanonLiberiaLithuaniaMalaysiaMexicoMicronesiaMiddle AfricaMoldovaMoroccoNepalNetherlandsNicaraguaNigeriaNorth AmericaNorth MacedoniaNorthern AfricaNorthern EuropeNorwayOceaniaPakistanPanamaPeruPhilippinesPolandPortugalRomaniaRussiaSaudi ArabiaScotlandSenegalSerbiaSierra LeoneSingaporeSomaliaSouth AfricaSouth AmericaSouth Central AsiaSouth Eastern AsiaSouthern EuropeSpainSri LankaSt. Vincent and the GrenadinesSudanSwedenSwitzerlandSyriaTaiwanThailandTrinidad and TobagoUgandaUkraineUruguayUzbekistanVenezuelaVietnamWest IndiesWestern AfricaWestern AsiaWestern EuropeYemenZaireZimbabweAzores
Married-Couple Family Poverty
Income
Poverty
Unemployment
Labor Participation
Family Structure
Vehicle Availability
Education Level
Disability

Immigrants from Turkey Married-Couple Family Poverty
Exceptional

4.6%
POVERTY | MARRIED-COUPLE FAMILIES
98.6/ 100
METRIC RATING
86th/ 347
METRIC RANK

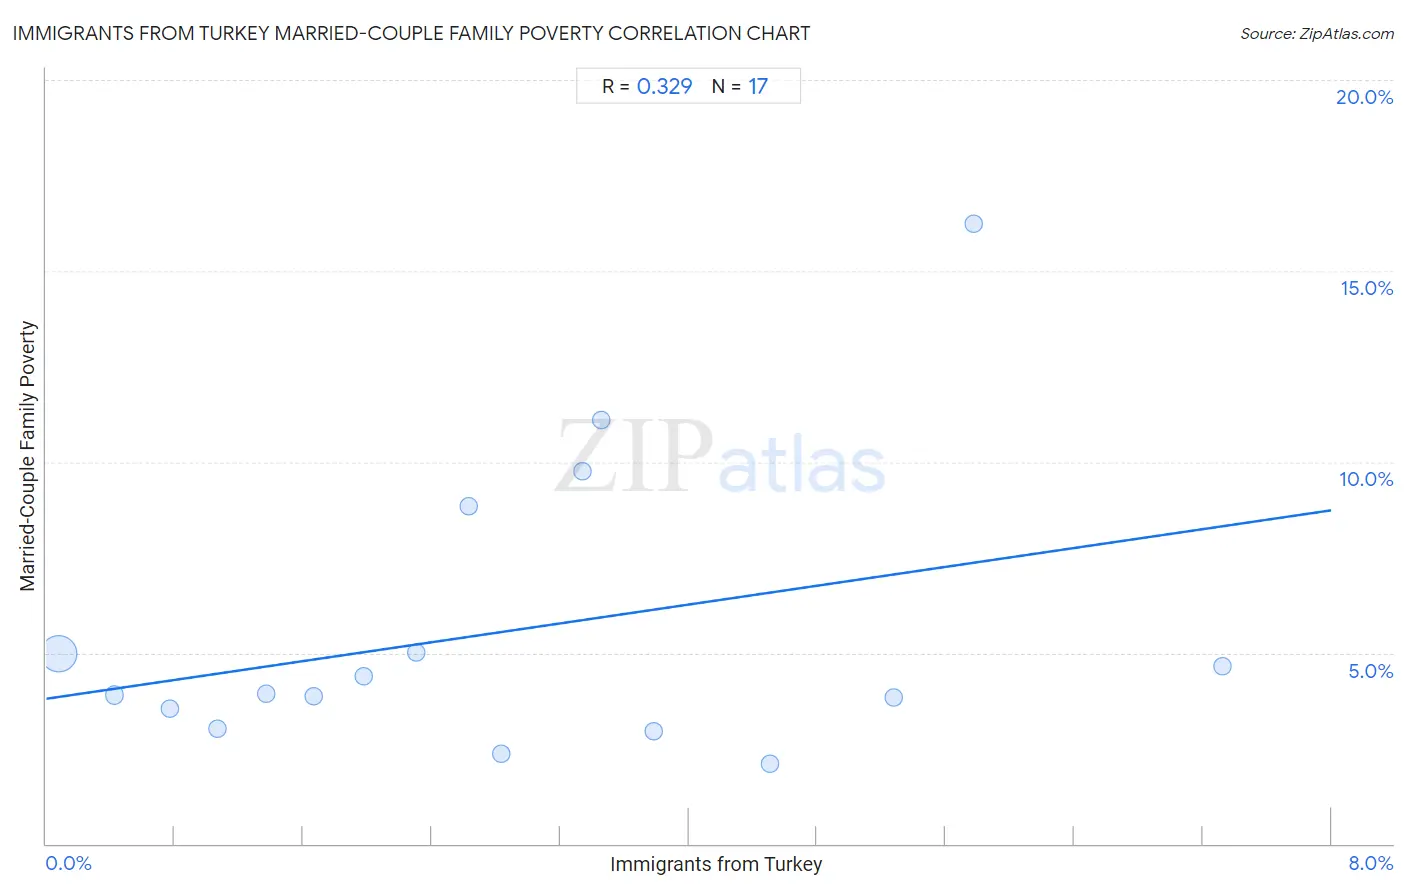
Immigrants from Turkey Married-Couple Family Poverty Correlation Chart

The statistical analysis conducted on geographies consisting of 221,764,079 people shows a mild positive correlation between the proportion of Immigrants from Turkey and poverty level among married-couple families in the United States with a correlation coefficient (R) of 0.329 and weighted average of 4.6%. On average, for every 1% (one percent) increase in Immigrants from Turkey within a typical geography, there is an increase of 0.62% in poverty level among married-couple families.
Immigrants from Turkey Married-Couple Family Poverty
It is essential to understand that the correlation between the percentage of Immigrants from Turkey and poverty level among married-couple families does not imply a direct cause-and-effect relationship. It remains uncertain whether the presence of Immigrants from Turkey influences an upward or downward trend in the level of poverty level among married-couple families within an area, or if Immigrants from Turkey simply ended up residing in those areas with higher or lower levels of poverty level among married-couple families due to other factors.

Demographics Similar to Immigrants from Turkey by Married-Couple Family Poverty

In terms of married-couple family poverty, the demographic groups most similar to Immigrants from Turkey are South African (4.6%, a difference of 0.040%), Immigrants from North Macedonia (4.6%, a difference of 0.080%), Bolivian (4.6%, a difference of 0.18%), Immigrants from Croatia (4.6%, a difference of 0.27%), and Immigrants from Czechoslovakia (4.6%, a difference of 0.29%).
DemographicsRating | RankMarried-Couple Family Poverty
Immigrants from Iran
99.0
/100
|
#79
Exceptional
4.5%
Icelanders
99.0
/100
|
#80
Exceptional
4.5%
Immigrants from Greece
98.9
/100
|
#81
Exceptional
4.5%
Canadians
98.8
/100
|
#82
Exceptional
4.5%
Immigrants from Denmark
98.8
/100
|
#83
Exceptional
4.6%
Immigrants from Croatia
98.7
/100
|
#84
Exceptional
4.6%
South Africans
98.7
/100
|
#85
Exceptional
4.6%
Immigrants from Turkey
98.6
/100
|
#86
Exceptional
4.6%
Immigrants from North Macedonia
98.6
/100
|
#87
Exceptional
4.6%
Bolivians
98.6
/100
|
#88
Exceptional
4.6%
Immigrants from Czechoslovakia
98.5
/100
|
#89
Exceptional
4.6%
Immigrants from Switzerland
98.5
/100
|
#90
Exceptional
4.6%
Basques
98.5
/100
|
#91
Exceptional
4.6%
Immigrants from Norway
98.4
/100
|
#92
Exceptional
4.6%
Koreans
98.3
/100
|
#93
Exceptional
4.6%

Immigrants from Turkey Married-Couple Family Poverty Correlation Summary

MeasurementImmigrants from Turkey DataMarried-Couple Family Poverty Data
Minimum0.074%2.1%
Maximum7.3%16.2%
Range7.2%14.1%
Mean2.9%5.6%
Median2.6%3.9%
Interquartile 25% (IQ1)1.2%3.3%
Interquartile 75% (IQ3)4.1%6.9%
Interquartile Range (IQR)2.9%3.7%
Standard Deviation (Sample)2.0%3.8%
Standard Deviation (Population)1.9%3.7%

Correlation Details

Immigrants from Turkey PercentileSample SizeMarried-Couple Family Poverty
[
0.0%
-
0.5%
]
0.074%
205,043,6315.0%
[
0.0%
-
0.5%
]
0.42%
12,593,6193.9%
[
0.5%
-
1.0%
]
0.77%
2,230,5633.5%
[
1.0%
-
1.5%
]
1.06%
814,7303.0%
[
1.0%
-
1.5%
]
1.37%
294,1023.9%
[
1.5%
-
2.0%
]
1.66%
331,4493.9%
[
1.5%
-
2.0%
]
1.98%
283,5314.4%
[
2.0%
-
2.5%
]
2.30%
57,3725.0%
[
2.5%
-
3.0%
]
2.63%
44,8358.8%
[
2.5%
-
3.0%
]
2.83%
29,4232.3%
[
3.0%
-
3.5%
]
3.34%
2,1289.8%
[
3.0%
-
3.5%
]
3.46%
43411.1%
[
3.5%
-
4.0%
]
3.78%
17,2402.9%
[
4.5%
-
5.0%
]
4.51%
2,4402.1%
[
5.0%
-
5.5%
]
5.28%
1,6483.8%
[
5.5%
-
6.0%
]
5.78%
11,45816.2%
[
7.0%
-
7.5%
]
7.32%
5,4764.7%