Estonian Married-Couple Family Poverty

COMPARE

Estonian
Race
Ancestry
AfghanAfricanAlaska NativeAlaskan AthabascanAlbanianAleutAlsatianAmericanApacheArabArapahoArgentineanArmenianAssyrian/Chaldean/SyriacAustralianAustrianBahamianBangladeshiBarbadianBasqueBelgianBelizeanBermudanBhutaneseBlackfeetBolivianBrazilianBritishBritish West IndianBulgarianBurmeseCajunCambodianCanadianCape VerdeanCarpatho RusynCelticCentral AmericanCentral American IndianCherokeeCheyenneChickasawChileanChineseChippewaChoctawColombianColvilleComancheCosta RicanCreeCreekCroatianCrowCubanCypriotCzechCzechoslovakianDanishDelawareDominicanDutchDutch West IndianEastern EuropeanEcuadorianEgyptianEnglishEstonianEthiopianEuropeanFijianFilipinoFinnishFrenchFrench American IndianFrench CanadianGermanGerman RussianGhanaianGreekGuamanian/ChamorroGuatemalanGuyaneseHaitianHmongHonduranHopiHoumaHungarianIcelanderIndian (Asian)IndonesianInupiatIranianIraqiIrishIroquoisIsraeliItalianJamaicanJapaneseJordanianKenyanKiowaKoreanLaotianLatvianLebaneseLiberianLithuanianLumbeeLuxembourgerMacedonianMalaysianMalteseMarshalleseMenomineeMexicanMexican American IndianMongolianMoroccanNative HawaiianNavajoNepaleseNew ZealanderNicaraguanNigerianNorthern EuropeanNorwegianOkinawanOsageOttawaPaiutePakistaniPalestinianPanamanianParaguayanPennsylvania GermanPeruvianPimaPolishPortuguesePotawatomiPuebloPuerto RicanPuget Sound SalishRomanianRussianSalvadoranSamoanScandinavianScotch-IrishScottishSeminoleSenegaleseSerbianShoshoneSierra LeoneanSiouxSlavicSlovakSloveneSomaliSouth AfricanSouth AmericanSouth American IndianSoviet UnionSpaniardSpanishSpanish AmericanSpanish American IndianSri LankanSubsaharan AfricanSudaneseSwedishSwissSyrianTaiwaneseThaiTlingit-HaidaTohono O'OdhamTonganTrinidadian and TobagonianTsimshianTurkishU.S. Virgin IslanderUgandanUkrainianUruguayanUteVenezuelanVietnameseWelshWest IndianYakamaYaquiYugoslavianYumanYup'ikZimbabwean
Immigration
NonimmigrantsImmigrantsAfghanistanAfricaAlbaniaArgentinaArmeniaAsiaAustraliaAustriaBahamasBangladeshBarbadosBelarusBelgiumBelizeBoliviaBosnia and HerzegovinaBrazilBulgariaBurma/MyanmarCabo VerdeCambodiaCameroonCanadaCaribbeanCentral AmericaChileChinaColombiaCongoCosta RicaCroatiaCubaCzechoslovakiaDenmarkDominicaDominican RepublicEastern AfricaEastern AsiaEastern EuropeEcuadorEgyptEl SalvadorEnglandEritreaEthiopiaEuropeFijiFranceGermanyGhanaGreeceGrenadaGuatemalaGuyanaHaitiHondurasHong KongHungaryIndiaIndonesiaIranIraqIrelandIsraelItalyJamaicaJapanJordanKazakhstanKenyaKoreaKuwaitLaosLatin AmericaLatviaLebanonLiberiaLithuaniaMalaysiaMexicoMicronesiaMiddle AfricaMoldovaMoroccoNepalNetherlandsNicaraguaNigeriaNorth AmericaNorth MacedoniaNorthern AfricaNorthern EuropeNorwayOceaniaPakistanPanamaPeruPhilippinesPolandPortugalRomaniaRussiaSaudi ArabiaScotlandSenegalSerbiaSierra LeoneSingaporeSomaliaSouth AfricaSouth AmericaSouth Central AsiaSouth Eastern AsiaSouthern EuropeSpainSri LankaSt. Vincent and the GrenadinesSudanSwedenSwitzerlandSyriaTaiwanThailandTrinidad and TobagoTurkeyUgandaUkraineUruguayUzbekistanVenezuelaVietnamWest IndiesWestern AfricaWestern AsiaWestern EuropeYemenZaireZimbabweAzores
Select to Compare
Race
Ancestry
AfghanAfricanAlaska NativeAlaskan AthabascanAlbanianAleutAlsatianAmericanApacheArabArapahoArgentineanArmenianAssyrian/Chaldean/SyriacAustralianAustrianBahamianBangladeshiBarbadianBasqueBelgianBelizeanBermudanBhutaneseBlackfeetBolivianBrazilianBritishBritish West IndianBulgarianBurmeseCajunCambodianCanadianCape VerdeanCarpatho RusynCelticCentral AmericanCentral American IndianCherokeeCheyenneChickasawChileanChineseChippewaChoctawColombianColvilleComancheCosta RicanCreeCreekCroatianCrowCubanCypriotCzechCzechoslovakianDanishDelawareDominicanDutchDutch West IndianEastern EuropeanEcuadorianEgyptianEnglishEthiopianEuropeanFijianFilipinoFinnishFrenchFrench American IndianFrench CanadianGermanGerman RussianGhanaianGreekGuamanian/ChamorroGuatemalanGuyaneseHaitianHmongHonduranHopiHoumaHungarianIcelanderIndian (Asian)IndonesianInupiatIranianIraqiIrishIroquoisIsraeliItalianJamaicanJapaneseJordanianKenyanKiowaKoreanLaotianLatvianLebaneseLiberianLithuanianLumbeeLuxembourgerMacedonianMalaysianMalteseMarshalleseMenomineeMexicanMexican American IndianMongolianMoroccanNative HawaiianNavajoNepaleseNew ZealanderNicaraguanNigerianNorthern EuropeanNorwegianOkinawanOsageOttawaPaiutePakistaniPalestinianPanamanianParaguayanPennsylvania GermanPeruvianPimaPolishPortuguesePotawatomiPuebloPuerto RicanPuget Sound SalishRomanianRussianSalvadoranSamoanScandinavianScotch-IrishScottishSeminoleSenegaleseSerbianShoshoneSierra LeoneanSiouxSlavicSlovakSloveneSomaliSouth AfricanSouth AmericanSouth American IndianSoviet UnionSpaniardSpanishSpanish AmericanSpanish American IndianSri LankanSubsaharan AfricanSudaneseSwedishSwissSyrianTaiwaneseThaiTlingit-HaidaTohono O'OdhamTonganTrinidadian and TobagonianTsimshianTurkishU.S. Virgin IslanderUgandanUkrainianUruguayanUteVenezuelanVietnameseWelshWest IndianYakamaYaquiYugoslavianYumanYup'ikZimbabwean
Immigration
NonimmigrantsImmigrantsAfghanistanAfricaAlbaniaArgentinaArmeniaAsiaAustraliaAustriaBahamasBangladeshBarbadosBelarusBelgiumBelizeBoliviaBosnia and HerzegovinaBrazilBulgariaBurma/MyanmarCabo VerdeCambodiaCameroonCanadaCaribbeanCentral AmericaChileChinaColombiaCongoCosta RicaCroatiaCubaCzechoslovakiaDenmarkDominicaDominican RepublicEastern AfricaEastern AsiaEastern EuropeEcuadorEgyptEl SalvadorEnglandEritreaEthiopiaEuropeFijiFranceGermanyGhanaGreeceGrenadaGuatemalaGuyanaHaitiHondurasHong KongHungaryIndiaIndonesiaIranIraqIrelandIsraelItalyJamaicaJapanJordanKazakhstanKenyaKoreaKuwaitLaosLatin AmericaLatviaLebanonLiberiaLithuaniaMalaysiaMexicoMicronesiaMiddle AfricaMoldovaMoroccoNepalNetherlandsNicaraguaNigeriaNorth AmericaNorth MacedoniaNorthern AfricaNorthern EuropeNorwayOceaniaPakistanPanamaPeruPhilippinesPolandPortugalRomaniaRussiaSaudi ArabiaScotlandSenegalSerbiaSierra LeoneSingaporeSomaliaSouth AfricaSouth AmericaSouth Central AsiaSouth Eastern AsiaSouthern EuropeSpainSri LankaSt. Vincent and the GrenadinesSudanSwedenSwitzerlandSyriaTaiwanThailandTrinidad and TobagoTurkeyUgandaUkraineUruguayUzbekistanVenezuelaVietnamWest IndiesWestern AfricaWestern AsiaWestern EuropeYemenZaireZimbabweAzores
Married-Couple Family Poverty
Income
Poverty
Unemployment
Labor Participation
Family Structure
Vehicle Availability
Education Level
Disability

Estonian Married-Couple Family Poverty
Exceptional

4.2%
POVERTY | MARRIED-COUPLE FAMILIES
99.9/ 100
METRIC RATING
31st/ 347
METRIC RANK

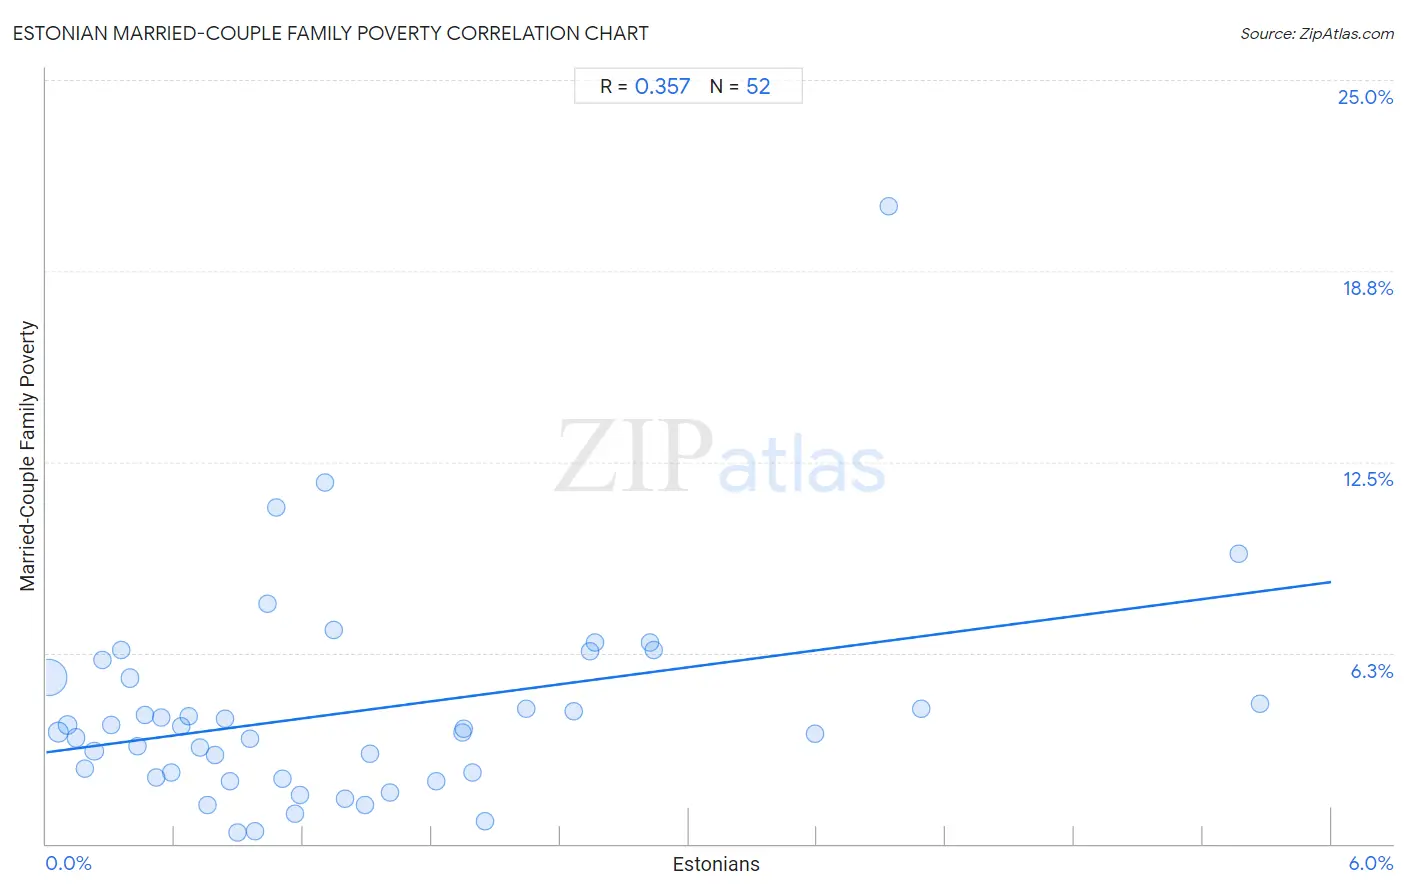
Estonian Married-Couple Family Poverty Correlation Chart

The statistical analysis conducted on geographies consisting of 123,069,874 people shows a mild positive correlation between the proportion of Estonians and poverty level among married-couple families in the United States with a correlation coefficient (R) of 0.357 and weighted average of 4.2%. On average, for every 1% (one percent) increase in Estonians within a typical geography, there is an increase of 0.93% in poverty level among married-couple families.
Estonian Married-Couple Family Poverty
It is essential to understand that the correlation between the percentage of Estonians and poverty level among married-couple families does not imply a direct cause-and-effect relationship. It remains uncertain whether the presence of Estonians influences an upward or downward trend in the level of poverty level among married-couple families within an area, or if Estonians simply ended up residing in those areas with higher or lower levels of poverty level among married-couple families due to other factors.

Demographics Similar to Estonians by Married-Couple Family Poverty

In terms of married-couple family poverty, the demographic groups most similar to Estonians are Finnish (4.2%, a difference of 0.080%), Greek (4.2%, a difference of 0.11%), Immigrants from Scotland (4.2%, a difference of 0.32%), Scandinavian (4.1%, a difference of 0.36%), and Danish (4.1%, a difference of 0.47%).
DemographicsRating | RankMarried-Couple Family Poverty
Eastern Europeans
99.9
/100
|
#24
Exceptional
4.1%
Immigrants from Taiwan
99.9
/100
|
#25
Exceptional
4.1%
Cypriots
99.9
/100
|
#26
Exceptional
4.1%
Danes
99.9
/100
|
#27
Exceptional
4.1%
Scandinavians
99.9
/100
|
#28
Exceptional
4.1%
Immigrants from Scotland
99.9
/100
|
#29
Exceptional
4.2%
Finns
99.9
/100
|
#30
Exceptional
4.2%
Estonians
99.9
/100
|
#31
Exceptional
4.2%
Greeks
99.9
/100
|
#32
Exceptional
4.2%
Irish
99.9
/100
|
#33
Exceptional
4.2%
Dutch
99.9
/100
|
#34
Exceptional
4.2%
Europeans
99.9
/100
|
#35
Exceptional
4.2%
English
99.9
/100
|
#36
Exceptional
4.2%
Iranians
99.9
/100
|
#37
Exceptional
4.2%
Belgians
99.9
/100
|
#38
Exceptional
4.2%

Estonian Married-Couple Family Poverty Correlation Summary

MeasurementEstonian DataMarried-Couple Family Poverty Data
Minimum0.014%0.39%
Maximum5.7%20.8%
Range5.7%20.5%
Mean1.4%4.3%
Median1.1%3.7%
Interquartile 25% (IQ1)0.53%2.2%
Interquartile 75% (IQ3)2.0%5.4%
Interquartile Range (IQR)1.4%3.2%
Standard Deviation (Sample)1.3%3.4%
Standard Deviation (Population)1.3%3.4%

Correlation Details

Estonian PercentileSample SizeMarried-Couple Family Poverty
[
0.0%
-
0.5%
]
0.014%
93,128,9705.5%
[
0.0%
-
0.5%
]
0.057%
16,385,0193.7%
[
0.0%
-
0.5%
]
0.099%
5,925,5423.9%
[
0.0%
-
0.5%
]
0.14%
3,083,0293.5%
[
0.0%
-
0.5%
]
0.18%
1,292,6712.5%
[
0.0%
-
0.5%
]
0.22%
991,8323.0%
[
0.0%
-
0.5%
]
0.26%
537,0186.0%
[
0.0%
-
0.5%
]
0.30%
409,9753.9%
[
0.0%
-
0.5%
]
0.35%
137,6936.4%
[
0.0%
-
0.5%
]
0.39%
272,2615.4%
[
0.0%
-
0.5%
]
0.43%
152,3073.2%
[
0.0%
-
0.5%
]
0.46%
152,7554.2%
[
0.5%
-
1.0%
]
0.51%
76,0262.2%
[
0.5%
-
1.0%
]
0.54%
90,9664.1%
[
0.5%
-
1.0%
]
0.58%
39,6792.3%
[
0.5%
-
1.0%
]
0.63%
58,2063.8%
[
0.5%
-
1.0%
]
0.66%
54,5254.2%
[
0.5%
-
1.0%
]
0.72%
11,2893.1%
[
0.5%
-
1.0%
]
0.76%
23,5751.3%
[
0.5%
-
1.0%
]
0.79%
21,3782.9%
[
0.5%
-
1.0%
]
0.83%
5,4064.1%
[
0.5%
-
1.0%
]
0.86%
65,9282.0%
[
0.5%
-
1.0%
]
0.89%
6,4950.39%
[
0.5%
-
1.0%
]
0.95%
16,6363.5%
[
0.5%
-
1.0%
]
0.98%
4,5040.42%
[
1.0%
-
1.5%
]
1.03%
2907.8%
[
1.0%
-
1.5%
]
1.08%
83711.0%
[
1.0%
-
1.5%
]
1.11%
22,5192.1%
[
1.0%
-
1.5%
]
1.16%
8,0120.97%
[
1.0%
-
1.5%
]
1.18%
4,4781.6%
[
1.0%
-
1.5%
]
1.30%
2,84211.8%
[
1.0%
-
1.5%
]
1.34%
6,1037.0%
[
1.0%
-
1.5%
]
1.40%
5,0851.5%
[
1.0%
-
1.5%
]
1.49%
3,6251.3%
[
1.5%
-
2.0%
]
1.51%
3,5002.9%
[
1.5%
-
2.0%
]
1.60%
9,9201.7%
[
1.5%
-
2.0%
]
1.82%
8,8512.0%
[
1.5%
-
2.0%
]
1.94%
1,4933.6%
[
1.5%
-
2.0%
]
1.95%
4,4613.8%
[
1.5%
-
2.0%
]
1.99%
8,4302.3%
[
2.0%
-
2.5%
]
2.05%
15,5990.72%
[
2.0%
-
2.5%
]
2.24%
1,2944.4%
[
2.0%
-
2.5%
]
2.46%
1,3004.3%
[
2.5%
-
3.0%
]
2.54%
3,8226.3%
[
2.5%
-
3.0%
]
2.56%
3,0436.6%
[
2.5%
-
3.0%
]
2.82%
3,4416.6%
[
2.5%
-
3.0%
]
2.84%
3176.3%
[
3.5%
-
4.0%
]
3.59%
2,2863.6%
[
3.5%
-
4.0%
]
3.94%
1,06720.8%
[
4.0%
-
4.5%
]
4.08%
1,5674.4%
[
5.5%
-
6.0%
]
5.57%
7549.5%
[
5.5%
-
6.0%
]
5.67%
1,2534.6%