Immigrants from Austria Married-Couple Family Poverty

COMPARE

Immigrants from Austria
Race
Ancestry
AfghanAfricanAlaska NativeAlaskan AthabascanAlbanianAleutAlsatianAmericanApacheArabArapahoArgentineanArmenianAssyrian/Chaldean/SyriacAustralianAustrianBahamianBangladeshiBarbadianBasqueBelgianBelizeanBermudanBhutaneseBlackfeetBolivianBrazilianBritishBritish West IndianBulgarianBurmeseCajunCambodianCanadianCape VerdeanCarpatho RusynCelticCentral AmericanCentral American IndianCherokeeCheyenneChickasawChileanChineseChippewaChoctawColombianColvilleComancheCosta RicanCreeCreekCroatianCrowCubanCypriotCzechCzechoslovakianDanishDelawareDominicanDutchDutch West IndianEastern EuropeanEcuadorianEgyptianEnglishEstonianEthiopianEuropeanFijianFilipinoFinnishFrenchFrench American IndianFrench CanadianGermanGerman RussianGhanaianGreekGuamanian/ChamorroGuatemalanGuyaneseHaitianHmongHonduranHopiHoumaHungarianIcelanderIndian (Asian)IndonesianInupiatIranianIraqiIrishIroquoisIsraeliItalianJamaicanJapaneseJordanianKenyanKiowaKoreanLaotianLatvianLebaneseLiberianLithuanianLumbeeLuxembourgerMacedonianMalaysianMalteseMarshalleseMenomineeMexicanMexican American IndianMongolianMoroccanNative HawaiianNavajoNepaleseNew ZealanderNicaraguanNigerianNorthern EuropeanNorwegianOkinawanOsageOttawaPaiutePakistaniPalestinianPanamanianParaguayanPennsylvania GermanPeruvianPimaPolishPortuguesePotawatomiPuebloPuerto RicanPuget Sound SalishRomanianRussianSalvadoranSamoanScandinavianScotch-IrishScottishSeminoleSenegaleseSerbianShoshoneSierra LeoneanSiouxSlavicSlovakSloveneSomaliSouth AfricanSouth AmericanSouth American IndianSoviet UnionSpaniardSpanishSpanish AmericanSpanish American IndianSri LankanSubsaharan AfricanSudaneseSwedishSwissSyrianTaiwaneseThaiTlingit-HaidaTohono O'OdhamTonganTrinidadian and TobagonianTsimshianTurkishU.S. Virgin IslanderUgandanUkrainianUruguayanUteVenezuelanVietnameseWelshWest IndianYakamaYaquiYugoslavianYumanYup'ikZimbabwean
Immigration
NonimmigrantsImmigrantsAfghanistanAfricaAlbaniaArgentinaArmeniaAsiaAustraliaAustriaBahamasBangladeshBarbadosBelarusBelgiumBelizeBoliviaBosnia and HerzegovinaBrazilBulgariaBurma/MyanmarCabo VerdeCambodiaCameroonCanadaCaribbeanCentral AmericaChileChinaColombiaCongoCosta RicaCroatiaCubaCzechoslovakiaDenmarkDominicaDominican RepublicEastern AfricaEastern AsiaEastern EuropeEcuadorEgyptEl SalvadorEnglandEritreaEthiopiaEuropeFijiFranceGermanyGhanaGreeceGrenadaGuatemalaGuyanaHaitiHondurasHong KongHungaryIndiaIndonesiaIranIraqIrelandIsraelItalyJamaicaJapanJordanKazakhstanKenyaKoreaKuwaitLaosLatin AmericaLatviaLebanonLiberiaLithuaniaMalaysiaMexicoMicronesiaMiddle AfricaMoldovaMoroccoNepalNetherlandsNicaraguaNigeriaNorth AmericaNorth MacedoniaNorthern AfricaNorthern EuropeNorwayOceaniaPakistanPanamaPeruPhilippinesPolandPortugalRomaniaRussiaSaudi ArabiaScotlandSenegalSerbiaSierra LeoneSingaporeSomaliaSouth AfricaSouth AmericaSouth Central AsiaSouth Eastern AsiaSouthern EuropeSpainSri LankaSt. Vincent and the GrenadinesSudanSwedenSwitzerlandSyriaTaiwanThailandTrinidad and TobagoTurkeyUgandaUkraineUruguayUzbekistanVenezuelaVietnamWest IndiesWestern AfricaWestern AsiaWestern EuropeYemenZaireZimbabweAzores
Select to Compare
Race
Ancestry
AfghanAfricanAlaska NativeAlaskan AthabascanAlbanianAleutAlsatianAmericanApacheArabArapahoArgentineanArmenianAssyrian/Chaldean/SyriacAustralianAustrianBahamianBangladeshiBarbadianBasqueBelgianBelizeanBermudanBhutaneseBlackfeetBolivianBrazilianBritishBritish West IndianBulgarianBurmeseCajunCambodianCanadianCape VerdeanCarpatho RusynCelticCentral AmericanCentral American IndianCherokeeCheyenneChickasawChileanChineseChippewaChoctawColombianColvilleComancheCosta RicanCreeCreekCroatianCrowCubanCypriotCzechCzechoslovakianDanishDelawareDominicanDutchDutch West IndianEastern EuropeanEcuadorianEgyptianEnglishEstonianEthiopianEuropeanFijianFilipinoFinnishFrenchFrench American IndianFrench CanadianGermanGerman RussianGhanaianGreekGuamanian/ChamorroGuatemalanGuyaneseHaitianHmongHonduranHopiHoumaHungarianIcelanderIndian (Asian)IndonesianInupiatIranianIraqiIrishIroquoisIsraeliItalianJamaicanJapaneseJordanianKenyanKiowaKoreanLaotianLatvianLebaneseLiberianLithuanianLumbeeLuxembourgerMacedonianMalaysianMalteseMarshalleseMenomineeMexicanMexican American IndianMongolianMoroccanNative HawaiianNavajoNepaleseNew ZealanderNicaraguanNigerianNorthern EuropeanNorwegianOkinawanOsageOttawaPaiutePakistaniPalestinianPanamanianParaguayanPennsylvania GermanPeruvianPimaPolishPortuguesePotawatomiPuebloPuerto RicanPuget Sound SalishRomanianRussianSalvadoranSamoanScandinavianScotch-IrishScottishSeminoleSenegaleseSerbianShoshoneSierra LeoneanSiouxSlavicSlovakSloveneSomaliSouth AfricanSouth AmericanSouth American IndianSoviet UnionSpaniardSpanishSpanish AmericanSpanish American IndianSri LankanSubsaharan AfricanSudaneseSwedishSwissSyrianTaiwaneseThaiTlingit-HaidaTohono O'OdhamTonganTrinidadian and TobagonianTsimshianTurkishU.S. Virgin IslanderUgandanUkrainianUruguayanUteVenezuelanVietnameseWelshWest IndianYakamaYaquiYugoslavianYumanYup'ikZimbabwean
Immigration
NonimmigrantsImmigrantsAfghanistanAfricaAlbaniaArgentinaArmeniaAsiaAustraliaBahamasBangladeshBarbadosBelarusBelgiumBelizeBoliviaBosnia and HerzegovinaBrazilBulgariaBurma/MyanmarCabo VerdeCambodiaCameroonCanadaCaribbeanCentral AmericaChileChinaColombiaCongoCosta RicaCroatiaCubaCzechoslovakiaDenmarkDominicaDominican RepublicEastern AfricaEastern AsiaEastern EuropeEcuadorEgyptEl SalvadorEnglandEritreaEthiopiaEuropeFijiFranceGermanyGhanaGreeceGrenadaGuatemalaGuyanaHaitiHondurasHong KongHungaryIndiaIndonesiaIranIraqIrelandIsraelItalyJamaicaJapanJordanKazakhstanKenyaKoreaKuwaitLaosLatin AmericaLatviaLebanonLiberiaLithuaniaMalaysiaMexicoMicronesiaMiddle AfricaMoldovaMoroccoNepalNetherlandsNicaraguaNigeriaNorth AmericaNorth MacedoniaNorthern AfricaNorthern EuropeNorwayOceaniaPakistanPanamaPeruPhilippinesPolandPortugalRomaniaRussiaSaudi ArabiaScotlandSenegalSerbiaSierra LeoneSingaporeSomaliaSouth AfricaSouth AmericaSouth Central AsiaSouth Eastern AsiaSouthern EuropeSpainSri LankaSt. Vincent and the GrenadinesSudanSwedenSwitzerlandSyriaTaiwanThailandTrinidad and TobagoTurkeyUgandaUkraineUruguayUzbekistanVenezuelaVietnamWest IndiesWestern AfricaWestern AsiaWestern EuropeYemenZaireZimbabweAzores
Married-Couple Family Poverty
Income
Poverty
Unemployment
Labor Participation
Family Structure
Vehicle Availability
Education Level
Disability

Immigrants from Austria Married-Couple Family Poverty
Exceptional

4.5%
POVERTY | MARRIED-COUPLE FAMILIES
99.2/ 100
METRIC RATING
74th/ 347
METRIC RANK

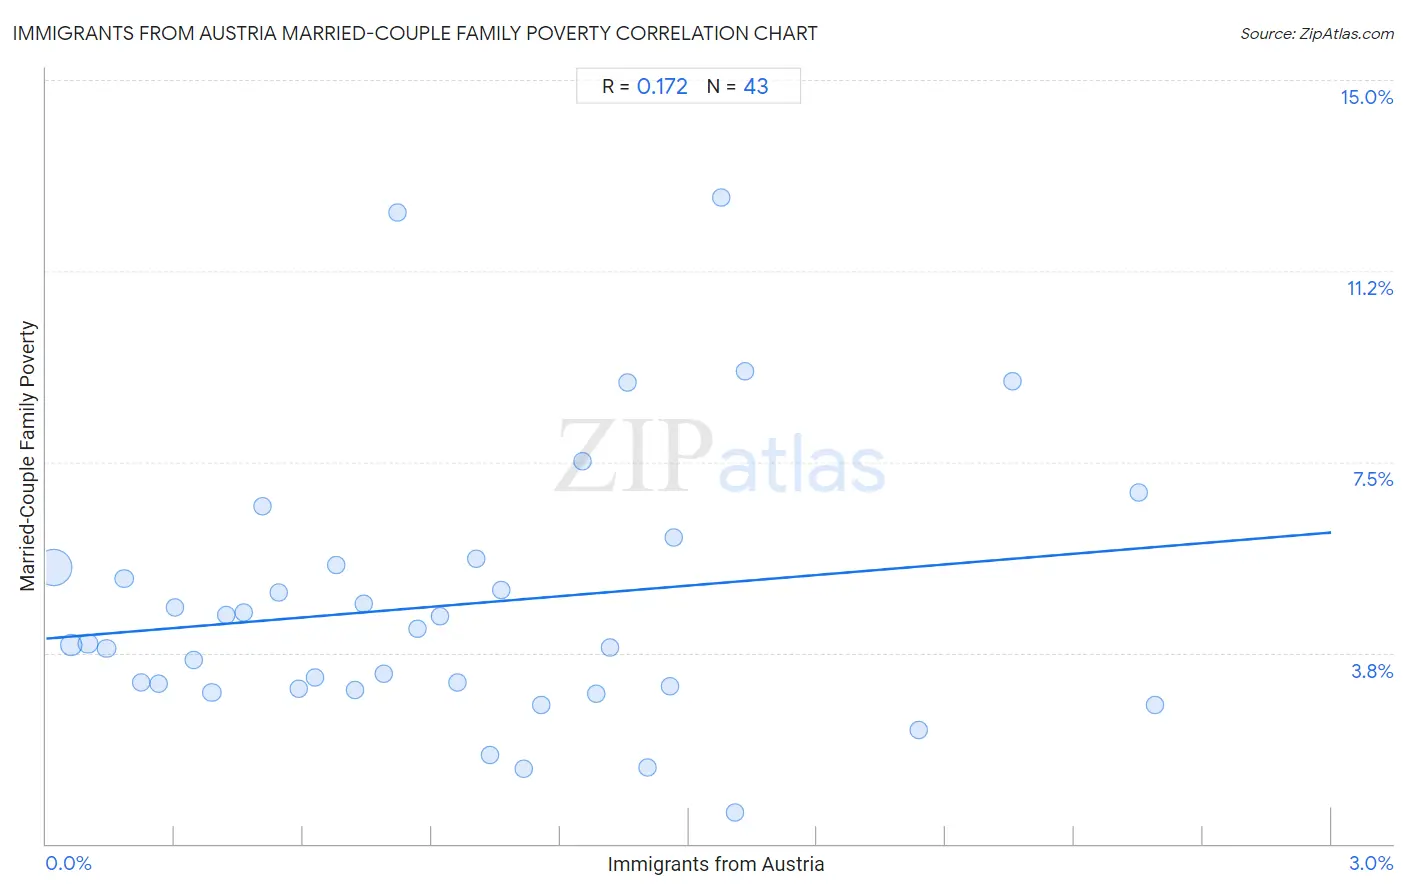
Immigrants from Austria Married-Couple Family Poverty Correlation Chart

The statistical analysis conducted on geographies consisting of 167,372,686 people shows a poor positive correlation between the proportion of Immigrants from Austria and poverty level among married-couple families in the United States with a correlation coefficient (R) of 0.172 and weighted average of 4.5%. On average, for every 1% (one percent) increase in Immigrants from Austria within a typical geography, there is an increase of 0.70% in poverty level among married-couple families.
Immigrants from Austria Married-Couple Family Poverty
It is essential to understand that the correlation between the percentage of Immigrants from Austria and poverty level among married-couple families does not imply a direct cause-and-effect relationship. It remains uncertain whether the presence of Immigrants from Austria influences an upward or downward trend in the level of poverty level among married-couple families within an area, or if Immigrants from Austria simply ended up residing in those areas with higher or lower levels of poverty level among married-couple families due to other factors.

Demographics Similar to Immigrants from Austria by Married-Couple Family Poverty

In terms of married-couple family poverty, the demographic groups most similar to Immigrants from Austria are Ukrainian (4.5%, a difference of 0.10%), Immigrants from England (4.5%, a difference of 0.22%), Cambodian (4.5%, a difference of 0.27%), Immigrants from North America (4.5%, a difference of 0.32%), and Immigrants from South Africa (4.5%, a difference of 0.38%).
DemographicsRating | RankMarried-Couple Family Poverty
Immigrants from Canada
99.4
/100
|
#67
Exceptional
4.4%
Slavs
99.4
/100
|
#68
Exceptional
4.4%
New Zealanders
99.4
/100
|
#69
Exceptional
4.4%
Immigrants from Korea
99.4
/100
|
#70
Exceptional
4.5%
Immigrants from North America
99.3
/100
|
#71
Exceptional
4.5%
Immigrants from England
99.3
/100
|
#72
Exceptional
4.5%
Ukrainians
99.2
/100
|
#73
Exceptional
4.5%
Immigrants from Austria
99.2
/100
|
#74
Exceptional
4.5%
Cambodians
99.2
/100
|
#75
Exceptional
4.5%
Immigrants from South Africa
99.1
/100
|
#76
Exceptional
4.5%
Immigrants from Latvia
99.1
/100
|
#77
Exceptional
4.5%
Scotch-Irish
99.1
/100
|
#78
Exceptional
4.5%
Immigrants from Iran
99.0
/100
|
#79
Exceptional
4.5%
Icelanders
99.0
/100
|
#80
Exceptional
4.5%
Immigrants from Greece
98.9
/100
|
#81
Exceptional
4.5%

Immigrants from Austria Married-Couple Family Poverty Correlation Summary

MeasurementImmigrants from Austria DataMarried-Couple Family Poverty Data
Minimum0.018%0.61%
Maximum2.6%12.7%
Range2.6%12.1%
Mean0.95%4.7%
Median0.87%3.9%
Interquartile 25% (IQ1)0.42%3.0%
Interquartile 75% (IQ3)1.4%5.5%
Interquartile Range (IQR)0.94%2.4%
Standard Deviation (Sample)0.65%2.6%
Standard Deviation (Population)0.64%2.6%

Correlation Details

Immigrants from Austria PercentileSample SizeMarried-Couple Family Poverty
[
0.0%
-
0.5%
]
0.018%
123,327,2035.4%
[
0.0%
-
0.5%
]
0.057%
24,660,9663.9%
[
0.0%
-
0.5%
]
0.097%
9,938,1173.9%
[
0.0%
-
0.5%
]
0.14%
3,575,5953.8%
[
0.0%
-
0.5%
]
0.18%
2,120,2795.2%
[
0.0%
-
0.5%
]
0.22%
905,3693.2%
[
0.0%
-
0.5%
]
0.26%
799,5763.1%
[
0.0%
-
0.5%
]
0.30%
540,5924.6%
[
0.0%
-
0.5%
]
0.34%
351,9823.6%
[
0.0%
-
0.5%
]
0.39%
223,4673.0%
[
0.0%
-
0.5%
]
0.42%
240,2364.5%
[
0.0%
-
0.5%
]
0.46%
109,2324.5%
[
0.5%
-
1.0%
]
0.50%
75,8226.6%
[
0.5%
-
1.0%
]
0.54%
72,4204.9%
[
0.5%
-
1.0%
]
0.59%
57,5563.0%
[
0.5%
-
1.0%
]
0.63%
45,7383.3%
[
0.5%
-
1.0%
]
0.68%
53,8315.5%
[
0.5%
-
1.0%
]
0.72%
73,5293.0%
[
0.5%
-
1.0%
]
0.74%
5,2594.7%
[
0.5%
-
1.0%
]
0.79%
4,6883.3%
[
0.5%
-
1.0%
]
0.82%
16,21012.4%
[
0.5%
-
1.0%
]
0.87%
61,0674.2%
[
0.5%
-
1.0%
]
0.92%
5,7714.5%
[
0.5%
-
1.0%
]
0.96%
6,0413.2%
[
1.0%
-
1.5%
]
1.00%
4,1855.6%
[
1.0%
-
1.5%
]
1.03%
1,5461.7%
[
1.0%
-
1.5%
]
1.06%
30,3705.0%
[
1.0%
-
1.5%
]
1.11%
5,7441.5%
[
1.0%
-
1.5%
]
1.15%
8662.7%
[
1.0%
-
1.5%
]
1.25%
1,5987.5%
[
1.0%
-
1.5%
]
1.28%
13,2512.9%
[
1.0%
-
1.5%
]
1.32%
3,1173.9%
[
1.0%
-
1.5%
]
1.36%
2,1359.0%
[
1.0%
-
1.5%
]
1.40%
4,2041.5%
[
1.0%
-
1.5%
]
1.46%
2,4743.1%
[
1.0%
-
1.5%
]
1.47%
16,0266.0%
[
1.5%
-
2.0%
]
1.58%
4,19012.7%
[
1.5%
-
2.0%
]
1.61%
2,3020.61%
[
1.5%
-
2.0%
]
1.63%
1,5339.3%
[
2.0%
-
2.5%
]
2.04%
1,3752.2%
[
2.0%
-
2.5%
]
2.26%
1339.1%
[
2.5%
-
3.0%
]
2.55%
1,6856.9%
[
2.5%
-
3.0%
]
2.59%
5,4062.7%