Peruvian Married-Couple Family Poverty
COMPARE
Peruvian
Select to Compare
Married-Couple Family Poverty
Peruvian Married-Couple Family Poverty
5.3%
POVERTY | MARRIED-COUPLE FAMILIES
37.6/ 100
METRIC RATING
183rd/ 347
METRIC RANK
Peruvian Married-Couple Family Poverty Correlation Chart
The statistical analysis conducted on geographies consisting of 360,614,929 people shows a very strong positive correlation between the proportion of Peruvians and poverty level among married-couple families in the United States with a correlation coefficient (R) of 0.865 and weighted average of 5.3%. On average, for every 1% (one percent) increase in Peruvians within a typical geography, there is an increase of 1.2% in poverty level among married-couple families.
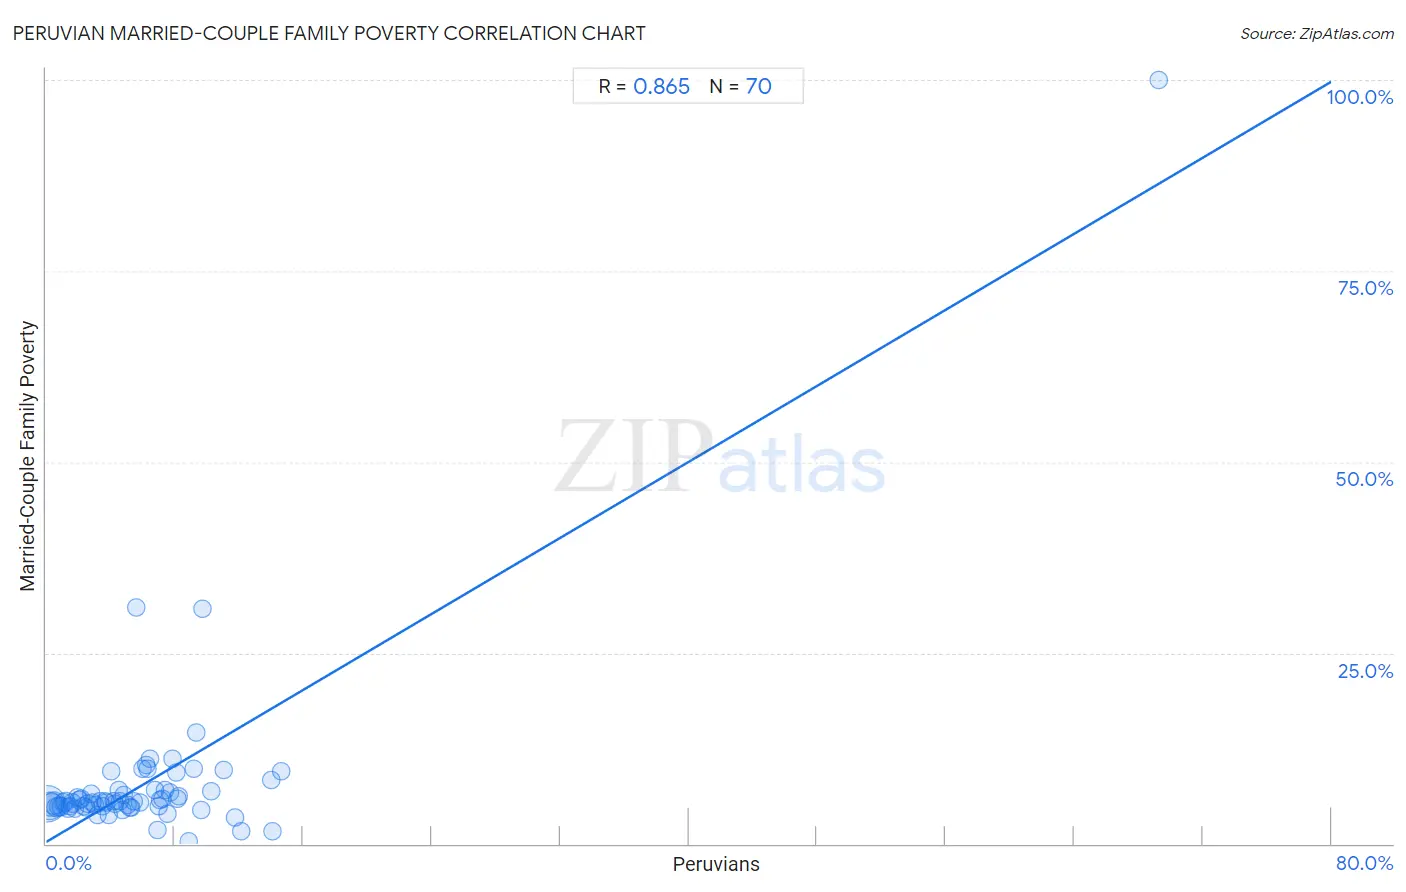
It is essential to understand that the correlation between the percentage of Peruvians and poverty level among married-couple families does not imply a direct cause-and-effect relationship. It remains uncertain whether the presence of Peruvians influences an upward or downward trend in the level of poverty level among married-couple families within an area, or if Peruvians simply ended up residing in those areas with higher or lower levels of poverty level among married-couple families due to other factors.
Demographics Similar to Peruvians by Married-Couple Family Poverty
In terms of married-couple family poverty, the demographic groups most similar to Peruvians are Immigrants from Vietnam (5.3%, a difference of 0.010%), Immigrants from Chile (5.3%, a difference of 0.14%), Immigrants from Sierra Leone (5.3%, a difference of 0.20%), Nonimmigrants (5.3%, a difference of 0.22%), and American (5.3%, a difference of 0.28%).
| Demographics | Rating | Rank | Married-Couple Family Poverty |
| Menominee | 47.8 /100 | #176 | Average 5.2% |
| Immigrants from Kazakhstan | 45.1 /100 | #177 | Average 5.2% |
| Immigrants from Ukraine | 44.9 /100 | #178 | Average 5.2% |
| Spanish | 41.4 /100 | #179 | Average 5.3% |
| Immigrants from Sierra Leone | 39.3 /100 | #180 | Fair 5.3% |
| Immigrants from Chile | 38.8 /100 | #181 | Fair 5.3% |
| Immigrants from Vietnam | 37.7 /100 | #182 | Fair 5.3% |
| Peruvians | 37.6 /100 | #183 | Fair 5.3% |
| Nonimmigrants | 35.8 /100 | #184 | Fair 5.3% |
| Americans | 35.4 /100 | #185 | Fair 5.3% |
| Hungarians | 34.7 /100 | #186 | Fair 5.3% |
| Immigrants from Albania | 33.8 /100 | #187 | Fair 5.3% |
| Israelis | 33.1 /100 | #188 | Fair 5.3% |
| South American Indians | 32.5 /100 | #189 | Fair 5.3% |
| Ugandans | 31.6 /100 | #190 | Fair 5.3% |
Peruvian Married-Couple Family Poverty Correlation Summary
| Measurement | Peruvian Data | Married-Couple Family Poverty Data |
| Minimum | 0.070% | 0.26% |
| Maximum | 69.3% | 100.0% |
| Range | 69.2% | 99.7% |
| Mean | 6.3% | 8.0% |
| Median | 4.9% | 5.5% |
| Interquartile 25% (IQ1) | 2.5% | 4.9% |
| Interquartile 75% (IQ3) | 7.7% | 7.0% |
| Interquartile Range (IQR) | 5.2% | 2.2% |
| Standard Deviation (Sample) | 8.4% | 12.1% |
| Standard Deviation (Population) | 8.4% | 12.1% |
Correlation Details
| Peruvian Percentile | Sample Size | Married-Couple Family Poverty |
[ 0.0% - 0.5% ] 0.070% | 148,976,963 | 5.3% |
[ 0.0% - 0.5% ] 0.20% | 85,006,724 | 4.9% |
[ 0.0% - 0.5% ] 0.35% | 40,873,044 | 5.0% |
[ 0.0% - 0.5% ] 0.49% | 31,712,263 | 5.3% |
[ 0.5% - 1.0% ] 0.63% | 13,768,394 | 4.8% |
[ 0.5% - 1.0% ] 0.77% | 7,906,207 | 4.9% |
[ 0.5% - 1.0% ] 0.93% | 5,691,652 | 4.9% |
[ 1.0% - 1.5% ] 1.06% | 4,571,791 | 5.3% |
[ 1.0% - 1.5% ] 1.20% | 3,496,291 | 5.5% |
[ 1.0% - 1.5% ] 1.35% | 2,789,160 | 4.7% |
[ 1.0% - 1.5% ] 1.49% | 1,867,462 | 4.9% |
[ 1.5% - 2.0% ] 1.63% | 1,631,995 | 5.3% |
[ 1.5% - 2.0% ] 1.77% | 1,884,863 | 4.6% |
[ 1.5% - 2.0% ] 1.92% | 1,767,361 | 6.1% |
[ 2.0% - 2.5% ] 2.06% | 975,751 | 5.7% |
[ 2.0% - 2.5% ] 2.18% | 780,743 | 5.9% |
[ 2.0% - 2.5% ] 2.33% | 864,407 | 4.9% |
[ 2.0% - 2.5% ] 2.47% | 806,046 | 4.8% |
[ 2.5% - 3.0% ] 2.60% | 692,938 | 5.3% |
[ 2.5% - 3.0% ] 2.77% | 544,333 | 6.6% |
[ 2.5% - 3.0% ] 2.89% | 313,012 | 5.4% |
[ 3.0% - 3.5% ] 3.05% | 599,616 | 5.0% |
[ 3.0% - 3.5% ] 3.20% | 209,327 | 3.7% |
[ 3.0% - 3.5% ] 3.33% | 410,072 | 5.6% |
[ 3.0% - 3.5% ] 3.49% | 233,228 | 5.0% |
[ 3.5% - 4.0% ] 3.64% | 254,528 | 5.6% |
[ 3.5% - 4.0% ] 3.74% | 236,368 | 5.4% |
[ 3.5% - 4.0% ] 3.91% | 20,731 | 3.8% |
[ 4.0% - 4.5% ] 4.04% | 225,915 | 9.4% |
[ 4.0% - 4.5% ] 4.19% | 80,817 | 5.5% |
[ 4.0% - 4.5% ] 4.32% | 23,948 | 5.3% |
[ 4.0% - 4.5% ] 4.48% | 181,548 | 7.1% |
[ 4.5% - 5.0% ] 4.62% | 217,878 | 5.5% |
[ 4.5% - 5.0% ] 4.76% | 76,854 | 4.5% |
[ 4.5% - 5.0% ] 4.84% | 67,521 | 6.4% |
[ 5.0% - 5.5% ] 5.04% | 98,715 | 5.1% |
[ 5.0% - 5.5% ] 5.22% | 71,584 | 4.7% |
[ 5.0% - 5.5% ] 5.31% | 3,088 | 4.8% |
[ 5.0% - 5.5% ] 5.43% | 65,932 | 5.5% |
[ 5.5% - 6.0% ] 5.59% | 716 | 30.9% |
[ 5.5% - 6.0% ] 5.84% | 23,992 | 5.3% |
[ 5.5% - 6.0% ] 5.99% | 10,133 | 9.9% |
[ 6.0% - 6.5% ] 6.19% | 182,097 | 10.3% |
[ 6.0% - 6.5% ] 6.29% | 47,848 | 9.8% |
[ 6.0% - 6.5% ] 6.49% | 6,901 | 11.1% |
[ 6.5% - 7.0% ] 6.76% | 47,290 | 7.0% |
[ 6.5% - 7.0% ] 6.93% | 8,660 | 1.8% |
[ 6.5% - 7.0% ] 6.98% | 3,781 | 4.9% |
[ 7.0% - 7.5% ] 7.11% | 17,048 | 5.7% |
[ 7.0% - 7.5% ] 7.27% | 4,967 | 5.9% |
[ 7.0% - 7.5% ] 7.40% | 9,320 | 7.0% |
[ 7.5% - 8.0% ] 7.58% | 963 | 3.9% |
[ 7.5% - 8.0% ] 7.70% | 40,263 | 6.8% |
[ 7.5% - 8.0% ] 7.89% | 38,572 | 11.2% |
[ 8.0% - 8.5% ] 8.06% | 29,533 | 9.3% |
[ 8.0% - 8.5% ] 8.14% | 1,056 | 5.9% |
[ 8.0% - 8.5% ] 8.29% | 1,074 | 6.2% |
[ 8.5% - 9.0% ] 8.90% | 2,101 | 0.26% |
[ 9.0% - 9.5% ] 9.16% | 3,528 | 9.8% |
[ 9.0% - 9.5% ] 9.34% | 22,377 | 14.5% |
[ 9.5% - 10.0% ] 9.62% | 82,314 | 4.4% |
[ 9.5% - 10.0% ] 9.71% | 6,166 | 30.8% |
[ 10.0% - 10.5% ] 10.26% | 1,277 | 6.8% |
[ 11.0% - 11.5% ] 11.02% | 581 | 9.7% |
[ 11.5% - 12.0% ] 11.77% | 11,069 | 3.4% |
[ 12.0% - 12.5% ] 12.13% | 4,947 | 1.7% |
[ 14.0% - 14.5% ] 14.04% | 57 | 8.3% |
[ 14.0% - 14.5% ] 14.08% | 6,299 | 1.7% |
[ 14.5% - 15.0% ] 14.60% | 815 | 9.5% |
[ 69.0% - 69.5% ] 69.30% | 114 | 100.0% |