Australian Married-Couple Family Poverty
COMPARE
Australian
Select to Compare
Married-Couple Family Poverty
Australian Married-Couple Family Poverty
4.3%
POVERTY | MARRIED-COUPLE FAMILIES
99.7/ 100
METRIC RATING
48th/ 347
METRIC RANK
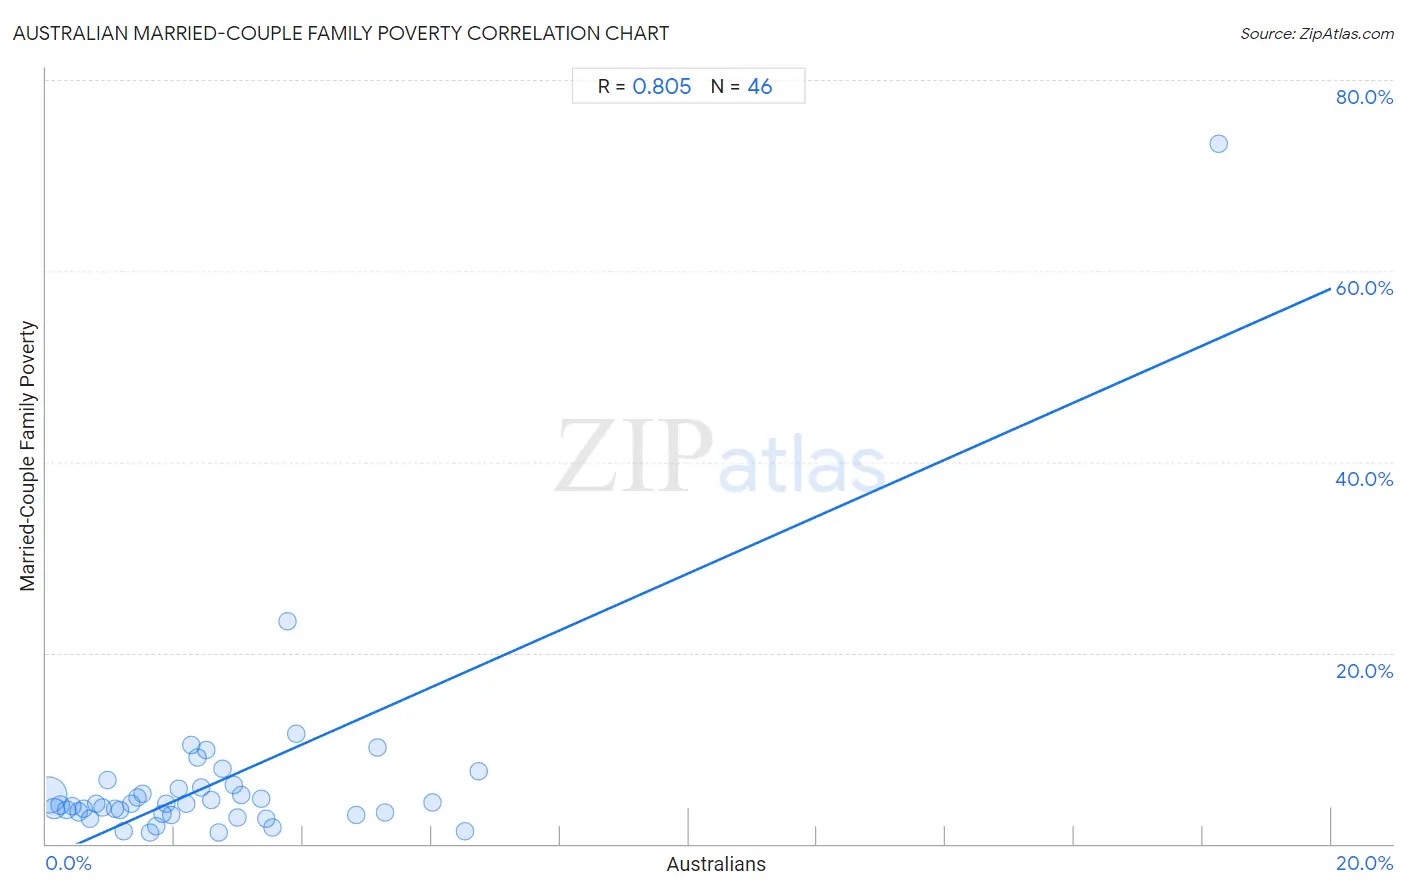
Australian Married-Couple Family Poverty Correlation Chart
The statistical analysis conducted on geographies consisting of 222,779,850 people shows a very strong positive correlation between the proportion of Australians and poverty level among married-couple families in the United States with a correlation coefficient (R) of 0.805 and weighted average of 4.3%. On average, for every 1% (one percent) increase in Australians within a typical geography, there is an increase of 3.0% in poverty level among married-couple families.
It is essential to understand that the correlation between the percentage of Australians and poverty level among married-couple families does not imply a direct cause-and-effect relationship. It remains uncertain whether the presence of Australians influences an upward or downward trend in the level of poverty level among married-couple families within an area, or if Australians simply ended up residing in those areas with higher or lower levels of poverty level among married-couple families due to other factors.
Demographics Similar to Australians by Married-Couple Family Poverty
In terms of married-couple family poverty, the demographic groups most similar to Australians are Immigrants from South Central Asia (4.3%, a difference of 0.070%), Turkish (4.3%, a difference of 0.080%), Burmese (4.3%, a difference of 0.18%), British (4.3%, a difference of 0.19%), and Immigrants from Lithuania (4.3%, a difference of 0.19%).
| Demographics | Rating | Rank | Married-Couple Family Poverty |
| Northern Europeans | 99.8 /100 | #41 | Exceptional 4.3% |
| Scottish | 99.8 /100 | #42 | Exceptional 4.3% |
| Swiss | 99.8 /100 | #43 | Exceptional 4.3% |
| Immigrants from Japan | 99.8 /100 | #44 | Exceptional 4.3% |
| Serbians | 99.8 /100 | #45 | Exceptional 4.3% |
| British | 99.8 /100 | #46 | Exceptional 4.3% |
| Immigrants from South Central Asia | 99.8 /100 | #47 | Exceptional 4.3% |
| Australians | 99.7 /100 | #48 | Exceptional 4.3% |
| Turks | 99.7 /100 | #49 | Exceptional 4.3% |
| Burmese | 99.7 /100 | #50 | Exceptional 4.3% |
| Immigrants from Lithuania | 99.7 /100 | #51 | Exceptional 4.3% |
| Russians | 99.7 /100 | #52 | Exceptional 4.3% |
| Welsh | 99.7 /100 | #53 | Exceptional 4.3% |
| Austrians | 99.7 /100 | #54 | Exceptional 4.3% |
| French | 99.7 /100 | #55 | Exceptional 4.3% |
Australian Married-Couple Family Poverty Correlation Summary
| Measurement | Australian Data | Married-Couple Family Poverty Data |
| Minimum | 0.037% | 1.1% |
| Maximum | 18.3% | 73.3% |
| Range | 18.2% | 72.2% |
| Mean | 2.7% | 6.5% |
| Median | 2.1% | 4.1% |
| Interquartile 25% (IQ1) | 1.1% | 3.2% |
| Interquartile 75% (IQ3) | 3.4% | 5.9% |
| Interquartile Range (IQR) | 2.3% | 2.7% |
| Standard Deviation (Sample) | 2.9% | 10.7% |
| Standard Deviation (Population) | 2.9% | 10.6% |
Correlation Details
| Australian Percentile | Sample Size | Married-Couple Family Poverty |
[ 0.0% - 0.5% ] 0.037% | 176,548,064 | 5.1% |
[ 0.0% - 0.5% ] 0.13% | 27,085,790 | 3.7% |
[ 0.0% - 0.5% ] 0.22% | 9,228,201 | 4.1% |
[ 0.0% - 0.5% ] 0.32% | 3,902,767 | 3.5% |
[ 0.0% - 0.5% ] 0.40% | 2,146,981 | 3.9% |
[ 0.5% - 1.0% ] 0.50% | 1,298,226 | 3.3% |
[ 0.5% - 1.0% ] 0.58% | 772,452 | 3.7% |
[ 0.5% - 1.0% ] 0.68% | 509,228 | 2.6% |
[ 0.5% - 1.0% ] 0.77% | 412,285 | 4.2% |
[ 0.5% - 1.0% ] 0.87% | 285,254 | 3.8% |
[ 0.5% - 1.0% ] 0.96% | 113,669 | 6.7% |
[ 1.0% - 1.5% ] 1.06% | 33,639 | 3.7% |
[ 1.0% - 1.5% ] 1.14% | 47,039 | 3.6% |
[ 1.0% - 1.5% ] 1.20% | 32,202 | 1.4% |
[ 1.0% - 1.5% ] 1.32% | 73,540 | 4.3% |
[ 1.0% - 1.5% ] 1.42% | 17,514 | 4.8% |
[ 1.5% - 2.0% ] 1.51% | 36,859 | 5.2% |
[ 1.5% - 2.0% ] 1.62% | 54,259 | 1.2% |
[ 1.5% - 2.0% ] 1.71% | 15,529 | 1.9% |
[ 1.5% - 2.0% ] 1.80% | 39,917 | 3.2% |
[ 1.5% - 2.0% ] 1.86% | 15,820 | 4.1% |
[ 1.5% - 2.0% ] 1.95% | 34,927 | 3.0% |
[ 2.0% - 2.5% ] 2.06% | 6,452 | 5.7% |
[ 2.0% - 2.5% ] 2.18% | 3,125 | 4.1% |
[ 2.0% - 2.5% ] 2.26% | 5,181 | 10.4% |
[ 2.0% - 2.5% ] 2.35% | 14,872 | 9.0% |
[ 2.0% - 2.5% ] 2.40% | 2,288 | 5.9% |
[ 2.0% - 2.5% ] 2.49% | 10,133 | 9.8% |
[ 2.5% - 3.0% ] 2.58% | 2,330 | 4.6% |
[ 2.5% - 3.0% ] 2.69% | 2,566 | 1.1% |
[ 2.5% - 3.0% ] 2.75% | 1,491 | 7.8% |
[ 2.5% - 3.0% ] 2.91% | 378 | 6.1% |
[ 2.5% - 3.0% ] 2.98% | 2,550 | 2.8% |
[ 3.0% - 3.5% ] 3.04% | 1,282 | 5.1% |
[ 3.0% - 3.5% ] 3.35% | 4,118 | 4.7% |
[ 3.0% - 3.5% ] 3.42% | 10,047 | 2.7% |
[ 3.5% - 4.0% ] 3.51% | 313 | 1.8% |
[ 3.5% - 4.0% ] 3.75% | 774 | 23.4% |
[ 3.5% - 4.0% ] 3.89% | 180 | 11.5% |
[ 4.5% - 5.0% ] 4.83% | 3,190 | 3.0% |
[ 5.0% - 5.5% ] 5.16% | 310 | 10.1% |
[ 5.0% - 5.5% ] 5.27% | 550 | 3.3% |
[ 6.0% - 6.5% ] 6.02% | 1,396 | 4.3% |
[ 6.5% - 7.0% ] 6.51% | 614 | 1.3% |
[ 6.5% - 7.0% ] 6.73% | 1,307 | 7.6% |
[ 18.0% - 18.5% ] 18.26% | 241 | 73.3% |