Bolivian Married-Couple Family Poverty
COMPARE
Bolivian
Select to Compare
Married-Couple Family Poverty
Bolivian Married-Couple Family Poverty
4.6%
POVERTY | MARRIED-COUPLE FAMILIES
98.6/ 100
METRIC RATING
88th/ 347
METRIC RANK
Bolivian Married-Couple Family Poverty Correlation Chart
The statistical analysis conducted on geographies consisting of 183,808,216 people shows a mild positive correlation between the proportion of Bolivians and poverty level among married-couple families in the United States with a correlation coefficient (R) of 0.303 and weighted average of 4.6%. On average, for every 1% (one percent) increase in Bolivians within a typical geography, there is an increase of 0.53% in poverty level among married-couple families.
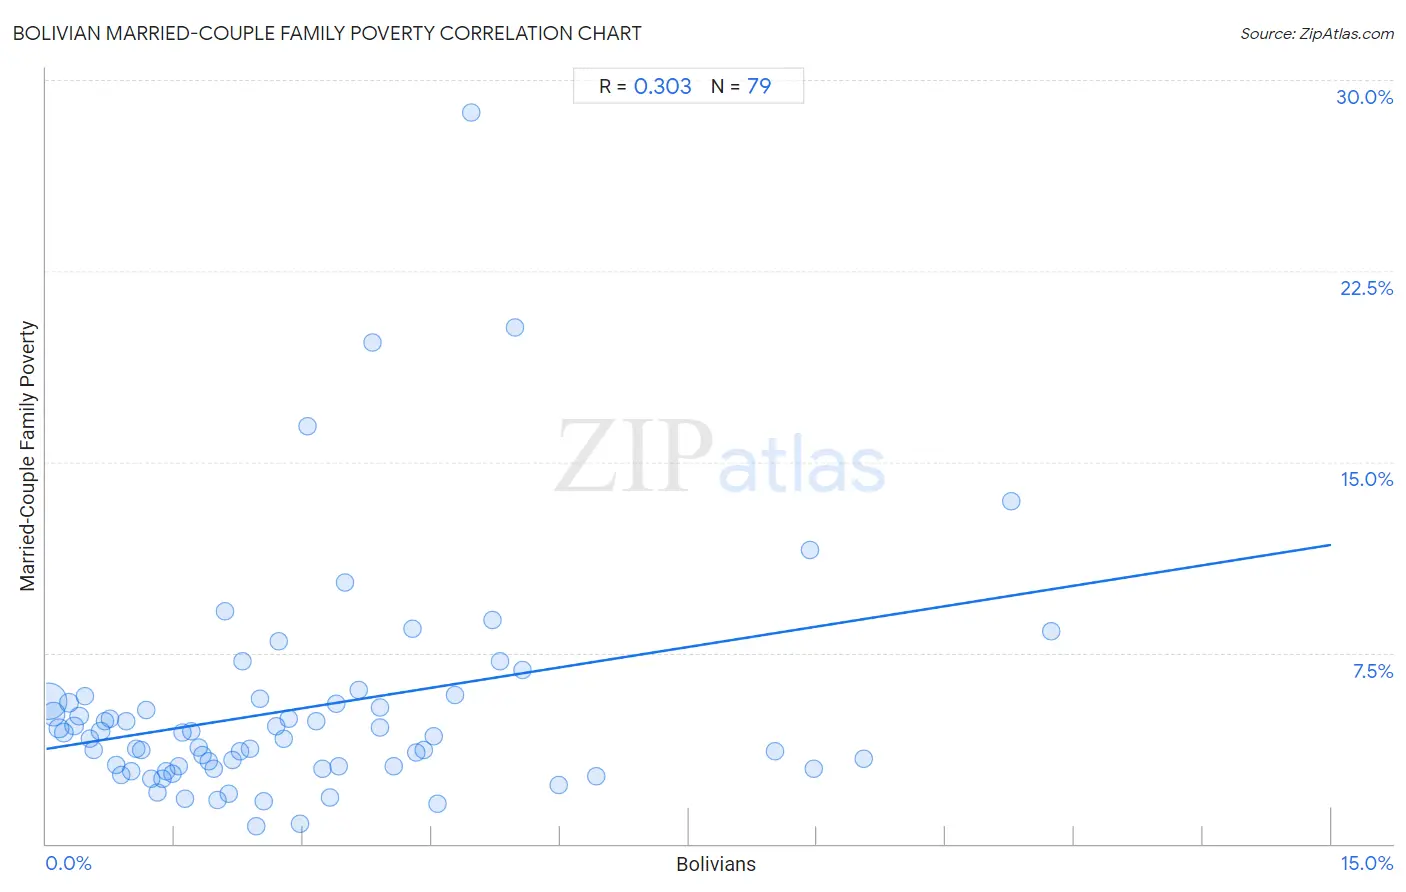
It is essential to understand that the correlation between the percentage of Bolivians and poverty level among married-couple families does not imply a direct cause-and-effect relationship. It remains uncertain whether the presence of Bolivians influences an upward or downward trend in the level of poverty level among married-couple families within an area, or if Bolivians simply ended up residing in those areas with higher or lower levels of poverty level among married-couple families due to other factors.
Demographics Similar to Bolivians by Married-Couple Family Poverty
In terms of married-couple family poverty, the demographic groups most similar to Bolivians are Immigrants from North Macedonia (4.6%, a difference of 0.10%), Immigrants from Czechoslovakia (4.6%, a difference of 0.11%), Immigrants from Turkey (4.6%, a difference of 0.18%), Immigrants from Switzerland (4.6%, a difference of 0.18%), and South African (4.6%, a difference of 0.22%).
| Demographics | Rating | Rank | Married-Couple Family Poverty |
| Immigrants from Greece | 98.9 /100 | #81 | Exceptional 4.5% |
| Canadians | 98.8 /100 | #82 | Exceptional 4.5% |
| Immigrants from Denmark | 98.8 /100 | #83 | Exceptional 4.6% |
| Immigrants from Croatia | 98.7 /100 | #84 | Exceptional 4.6% |
| South Africans | 98.7 /100 | #85 | Exceptional 4.6% |
| Immigrants from Turkey | 98.6 /100 | #86 | Exceptional 4.6% |
| Immigrants from North Macedonia | 98.6 /100 | #87 | Exceptional 4.6% |
| Bolivians | 98.6 /100 | #88 | Exceptional 4.6% |
| Immigrants from Czechoslovakia | 98.5 /100 | #89 | Exceptional 4.6% |
| Immigrants from Switzerland | 98.5 /100 | #90 | Exceptional 4.6% |
| Basques | 98.5 /100 | #91 | Exceptional 4.6% |
| Immigrants from Norway | 98.4 /100 | #92 | Exceptional 4.6% |
| Koreans | 98.3 /100 | #93 | Exceptional 4.6% |
| Immigrants from Italy | 98.3 /100 | #94 | Exceptional 4.6% |
| Portuguese | 98.3 /100 | #95 | Exceptional 4.6% |
Bolivian Married-Couple Family Poverty Correlation Summary
| Measurement | Bolivian Data | Married-Couple Family Poverty Data |
| Minimum | 0.028% | 0.69% |
| Maximum | 11.7% | 28.7% |
| Range | 11.7% | 28.0% |
| Mean | 3.0% | 5.3% |
| Median | 2.4% | 4.2% |
| Interquartile 25% (IQ1) | 1.2% | 3.0% |
| Interquartile 75% (IQ3) | 4.1% | 5.6% |
| Interquartile Range (IQR) | 2.9% | 2.6% |
| Standard Deviation (Sample) | 2.5% | 4.5% |
| Standard Deviation (Population) | 2.5% | 4.5% |
Correlation Details
| Bolivian Percentile | Sample Size | Married-Couple Family Poverty |
[ 0.0% - 0.5% ] 0.028% | 111,780,568 | 5.6% |
[ 0.0% - 0.5% ] 0.083% | 32,864,684 | 5.1% |
[ 0.0% - 0.5% ] 0.15% | 12,436,952 | 4.5% |
[ 0.0% - 0.5% ] 0.21% | 6,288,950 | 4.4% |
[ 0.0% - 0.5% ] 0.27% | 4,733,787 | 5.5% |
[ 0.0% - 0.5% ] 0.33% | 3,262,339 | 4.6% |
[ 0.0% - 0.5% ] 0.38% | 2,008,753 | 5.0% |
[ 0.0% - 0.5% ] 0.45% | 1,478,363 | 5.8% |
[ 0.5% - 1.0% ] 0.50% | 1,497,629 | 4.1% |
[ 0.5% - 1.0% ] 0.56% | 890,915 | 3.7% |
[ 0.5% - 1.0% ] 0.63% | 652,183 | 4.4% |
[ 0.5% - 1.0% ] 0.69% | 595,406 | 4.8% |
[ 0.5% - 1.0% ] 0.74% | 395,533 | 4.9% |
[ 0.5% - 1.0% ] 0.81% | 676,505 | 3.1% |
[ 0.5% - 1.0% ] 0.88% | 315,930 | 2.7% |
[ 0.5% - 1.0% ] 0.93% | 340,368 | 4.8% |
[ 0.5% - 1.0% ] 0.99% | 257,830 | 2.9% |
[ 1.0% - 1.5% ] 1.05% | 213,772 | 3.7% |
[ 1.0% - 1.5% ] 1.11% | 233,184 | 3.7% |
[ 1.0% - 1.5% ] 1.16% | 259,166 | 5.3% |
[ 1.0% - 1.5% ] 1.22% | 39,939 | 2.5% |
[ 1.0% - 1.5% ] 1.29% | 85,061 | 2.0% |
[ 1.0% - 1.5% ] 1.36% | 60,493 | 2.5% |
[ 1.0% - 1.5% ] 1.41% | 164,398 | 2.8% |
[ 1.0% - 1.5% ] 1.47% | 331,636 | 2.7% |
[ 1.5% - 2.0% ] 1.54% | 175,867 | 3.0% |
[ 1.5% - 2.0% ] 1.59% | 80,352 | 4.4% |
[ 1.5% - 2.0% ] 1.62% | 30,428 | 1.8% |
[ 1.5% - 2.0% ] 1.69% | 121,022 | 4.4% |
[ 1.5% - 2.0% ] 1.79% | 89,922 | 3.8% |
[ 1.5% - 2.0% ] 1.83% | 180,300 | 3.5% |
[ 1.5% - 2.0% ] 1.90% | 110,573 | 3.2% |
[ 1.5% - 2.0% ] 1.96% | 109,873 | 3.0% |
[ 2.0% - 2.5% ] 2.00% | 29,528 | 1.7% |
[ 2.0% - 2.5% ] 2.08% | 13,479 | 9.2% |
[ 2.0% - 2.5% ] 2.13% | 32,264 | 2.0% |
[ 2.0% - 2.5% ] 2.17% | 85,564 | 3.3% |
[ 2.0% - 2.5% ] 2.26% | 81,812 | 3.6% |
[ 2.0% - 2.5% ] 2.28% | 21,357 | 7.2% |
[ 2.0% - 2.5% ] 2.37% | 24,184 | 3.7% |
[ 2.0% - 2.5% ] 2.45% | 3,312 | 0.69% |
[ 2.0% - 2.5% ] 2.49% | 20,887 | 5.7% |
[ 2.5% - 3.0% ] 2.53% | 18,346 | 1.6% |
[ 2.5% - 3.0% ] 2.68% | 98,830 | 4.6% |
[ 2.5% - 3.0% ] 2.71% | 12,337 | 7.9% |
[ 2.5% - 3.0% ] 2.77% | 17,788 | 4.1% |
[ 2.5% - 3.0% ] 2.82% | 28,750 | 4.9% |
[ 2.5% - 3.0% ] 2.96% | 44,228 | 0.80% |
[ 3.0% - 3.5% ] 3.05% | 24,785 | 16.4% |
[ 3.0% - 3.5% ] 3.16% | 6,238 | 4.8% |
[ 3.0% - 3.5% ] 3.23% | 8,975 | 2.9% |
[ 3.0% - 3.5% ] 3.31% | 46,749 | 1.8% |
[ 3.0% - 3.5% ] 3.38% | 133,437 | 5.5% |
[ 3.0% - 3.5% ] 3.42% | 643 | 3.1% |
[ 3.0% - 3.5% ] 3.49% | 1,463 | 10.3% |
[ 3.5% - 4.0% ] 3.65% | 8,024 | 6.0% |
[ 3.5% - 4.0% ] 3.81% | 1,757 | 19.7% |
[ 3.5% - 4.0% ] 3.89% | 6,916 | 4.6% |
[ 3.5% - 4.0% ] 3.90% | 52,359 | 5.3% |
[ 4.0% - 4.5% ] 4.06% | 31,058 | 3.1% |
[ 4.0% - 4.5% ] 4.27% | 679 | 8.4% |
[ 4.0% - 4.5% ] 4.33% | 42,310 | 3.6% |
[ 4.0% - 4.5% ] 4.41% | 42,330 | 3.7% |
[ 4.5% - 5.0% ] 4.52% | 12,818 | 4.2% |
[ 4.5% - 5.0% ] 4.57% | 2,211 | 1.5% |
[ 4.5% - 5.0% ] 4.77% | 3,104 | 5.8% |
[ 4.5% - 5.0% ] 4.96% | 746 | 28.7% |
[ 5.0% - 5.5% ] 5.21% | 6,510 | 8.8% |
[ 5.0% - 5.5% ] 5.30% | 736 | 7.2% |
[ 5.0% - 5.5% ] 5.47% | 676 | 20.3% |
[ 5.5% - 6.0% ] 5.56% | 1,277 | 6.8% |
[ 5.5% - 6.0% ] 5.98% | 1,271 | 2.3% |
[ 6.0% - 6.5% ] 6.41% | 1,185 | 2.7% |
[ 8.5% - 9.0% ] 8.51% | 34,860 | 3.6% |
[ 8.5% - 9.0% ] 8.92% | 2,948 | 11.5% |
[ 8.5% - 9.0% ] 8.96% | 3,851 | 3.0% |
[ 9.5% - 10.0% ] 9.54% | 31,121 | 3.3% |
[ 11.0% - 11.5% ] 11.27% | 630 | 13.5% |
[ 11.5% - 12.0% ] 11.73% | 1,202 | 8.4% |