Filipino Married-Couple Family Poverty
COMPARE
Filipino
Select to Compare
Married-Couple Family Poverty
Filipino Married-Couple Family Poverty
4.0%
POVERTY | MARRIED-COUPLE FAMILIES
100.0/ 100
METRIC RATING
17th/ 347
METRIC RANK
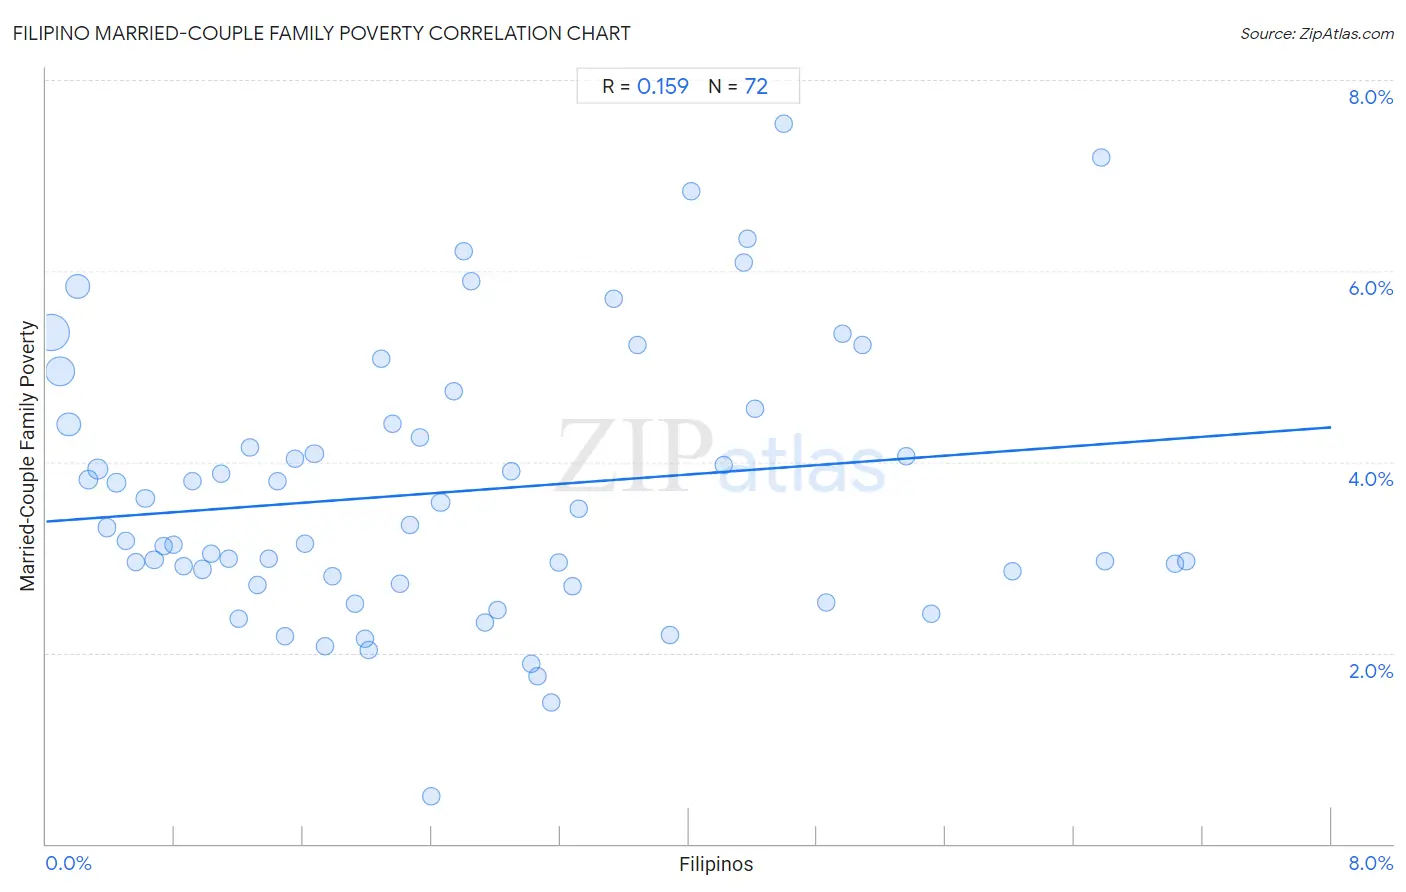
Filipino Married-Couple Family Poverty Correlation Chart
The statistical analysis conducted on geographies consisting of 252,645,683 people shows a poor positive correlation between the proportion of Filipinos and poverty level among married-couple families in the United States with a correlation coefficient (R) of 0.159 and weighted average of 4.0%. On average, for every 1% (one percent) increase in Filipinos within a typical geography, there is an increase of 0.12% in poverty level among married-couple families.
It is essential to understand that the correlation between the percentage of Filipinos and poverty level among married-couple families does not imply a direct cause-and-effect relationship. It remains uncertain whether the presence of Filipinos influences an upward or downward trend in the level of poverty level among married-couple families within an area, or if Filipinos simply ended up residing in those areas with higher or lower levels of poverty level among married-couple families due to other factors.
Demographics Similar to Filipinos by Married-Couple Family Poverty
In terms of married-couple family poverty, the demographic groups most similar to Filipinos are Italian (4.0%, a difference of 0.010%), German (4.0%, a difference of 0.030%), Polish (4.0%, a difference of 0.30%), Slovak (4.0%, a difference of 0.33%), and Czech (4.0%, a difference of 0.37%).
| Demographics | Rating | Rank | Married-Couple Family Poverty |
| Carpatho Rusyns | 100.0 /100 | #10 | Exceptional 3.9% |
| Lithuanians | 100.0 /100 | #11 | Exceptional 4.0% |
| Bulgarians | 100.0 /100 | #12 | Exceptional 4.0% |
| Czechs | 100.0 /100 | #13 | Exceptional 4.0% |
| Slovaks | 100.0 /100 | #14 | Exceptional 4.0% |
| Poles | 100.0 /100 | #15 | Exceptional 4.0% |
| Germans | 100.0 /100 | #16 | Exceptional 4.0% |
| Filipinos | 100.0 /100 | #17 | Exceptional 4.0% |
| Italians | 100.0 /100 | #18 | Exceptional 4.0% |
| Immigrants from Ireland | 99.9 /100 | #19 | Exceptional 4.1% |
| Maltese | 99.9 /100 | #20 | Exceptional 4.1% |
| Zimbabweans | 99.9 /100 | #21 | Exceptional 4.1% |
| Immigrants from Singapore | 99.9 /100 | #22 | Exceptional 4.1% |
| Bhutanese | 99.9 /100 | #23 | Exceptional 4.1% |
| Eastern Europeans | 99.9 /100 | #24 | Exceptional 4.1% |
Filipino Married-Couple Family Poverty Correlation Summary
| Measurement | Filipino Data | Married-Couple Family Poverty Data |
| Minimum | 0.030% | 0.49% |
| Maximum | 7.1% | 7.5% |
| Range | 7.1% | 7.0% |
| Mean | 2.5% | 3.7% |
| Median | 2.2% | 3.3% |
| Interquartile 25% (IQ1) | 1.1% | 2.8% |
| Interquartile 75% (IQ3) | 3.6% | 4.4% |
| Interquartile Range (IQR) | 2.6% | 1.6% |
| Standard Deviation (Sample) | 1.8% | 1.4% |
| Standard Deviation (Population) | 1.8% | 1.4% |
Correlation Details
| Filipino Percentile | Sample Size | Married-Couple Family Poverty |
[ 0.0% - 0.5% ] 0.030% | 89,050,251 | 5.4% |
[ 0.0% - 0.5% ] 0.084% | 52,389,035 | 5.0% |
[ 0.0% - 0.5% ] 0.14% | 29,375,462 | 4.4% |
[ 0.0% - 0.5% ] 0.20% | 27,886,737 | 5.8% |
[ 0.0% - 0.5% ] 0.26% | 9,287,406 | 3.8% |
[ 0.0% - 0.5% ] 0.32% | 9,218,116 | 3.9% |
[ 0.0% - 0.5% ] 0.38% | 5,158,412 | 3.3% |
[ 0.0% - 0.5% ] 0.44% | 3,804,770 | 3.8% |
[ 0.0% - 0.5% ] 0.50% | 3,478,449 | 3.2% |
[ 0.5% - 1.0% ] 0.56% | 3,774,818 | 3.0% |
[ 0.5% - 1.0% ] 0.62% | 2,831,093 | 3.6% |
[ 0.5% - 1.0% ] 0.67% | 1,766,094 | 3.0% |
[ 0.5% - 1.0% ] 0.73% | 1,447,236 | 3.1% |
[ 0.5% - 1.0% ] 0.79% | 2,741,061 | 3.1% |
[ 0.5% - 1.0% ] 0.86% | 1,000,506 | 2.9% |
[ 0.5% - 1.0% ] 0.91% | 762,966 | 3.8% |
[ 0.5% - 1.0% ] 0.97% | 729,886 | 2.9% |
[ 1.0% - 1.5% ] 1.02% | 638,994 | 3.0% |
[ 1.0% - 1.5% ] 1.09% | 1,008,481 | 3.9% |
[ 1.0% - 1.5% ] 1.14% | 323,186 | 3.0% |
[ 1.0% - 1.5% ] 1.20% | 338,008 | 2.4% |
[ 1.0% - 1.5% ] 1.27% | 525,329 | 4.2% |
[ 1.0% - 1.5% ] 1.32% | 611,296 | 2.7% |
[ 1.0% - 1.5% ] 1.39% | 386,216 | 3.0% |
[ 1.0% - 1.5% ] 1.44% | 324,330 | 3.8% |
[ 1.0% - 1.5% ] 1.49% | 239,946 | 2.2% |
[ 1.5% - 2.0% ] 1.55% | 215,734 | 4.0% |
[ 1.5% - 2.0% ] 1.61% | 253,757 | 3.1% |
[ 1.5% - 2.0% ] 1.67% | 251,325 | 4.1% |
[ 1.5% - 2.0% ] 1.74% | 69,594 | 2.1% |
[ 1.5% - 2.0% ] 1.78% | 367,033 | 2.8% |
[ 1.5% - 2.0% ] 1.92% | 176,167 | 2.5% |
[ 1.5% - 2.0% ] 1.98% | 138,170 | 2.1% |
[ 2.0% - 2.5% ] 2.01% | 35,887 | 2.0% |
[ 2.0% - 2.5% ] 2.08% | 7,007 | 5.1% |
[ 2.0% - 2.5% ] 2.15% | 55,974 | 4.4% |
[ 2.0% - 2.5% ] 2.20% | 26,562 | 2.7% |
[ 2.0% - 2.5% ] 2.27% | 93,573 | 3.3% |
[ 2.0% - 2.5% ] 2.33% | 422,728 | 4.3% |
[ 2.0% - 2.5% ] 2.40% | 5,999 | 0.49% |
[ 2.0% - 2.5% ] 2.46% | 180,681 | 3.6% |
[ 2.5% - 3.0% ] 2.54% | 41,660 | 4.7% |
[ 2.5% - 3.0% ] 2.60% | 110,950 | 6.2% |
[ 2.5% - 3.0% ] 2.65% | 27,409 | 5.9% |
[ 2.5% - 3.0% ] 2.74% | 68,329 | 2.3% |
[ 2.5% - 3.0% ] 2.81% | 59,763 | 2.4% |
[ 2.5% - 3.0% ] 2.90% | 55,404 | 3.9% |
[ 3.0% - 3.5% ] 3.02% | 89,131 | 1.9% |
[ 3.0% - 3.5% ] 3.06% | 92,595 | 1.8% |
[ 3.0% - 3.5% ] 3.14% | 30,771 | 1.5% |
[ 3.0% - 3.5% ] 3.19% | 32,548 | 2.9% |
[ 3.0% - 3.5% ] 3.28% | 10,685 | 2.7% |
[ 3.0% - 3.5% ] 3.32% | 31,335 | 3.5% |
[ 3.5% - 4.0% ] 3.54% | 24,041 | 5.7% |
[ 3.5% - 4.0% ] 3.68% | 54,534 | 5.2% |
[ 3.5% - 4.0% ] 3.88% | 53,464 | 2.2% |
[ 4.0% - 4.5% ] 4.01% | 89,154 | 6.8% |
[ 4.0% - 4.5% ] 4.22% | 31,986 | 4.0% |
[ 4.0% - 4.5% ] 4.34% | 61,110 | 6.1% |
[ 4.0% - 4.5% ] 4.36% | 28,212 | 6.3% |
[ 4.0% - 4.5% ] 4.41% | 54,484 | 4.6% |
[ 4.5% - 5.0% ] 4.59% | 47,209 | 7.5% |
[ 4.5% - 5.0% ] 4.85% | 783 | 2.5% |
[ 4.5% - 5.0% ] 4.96% | 2,240 | 5.3% |
[ 5.0% - 5.5% ] 5.09% | 57,536 | 5.2% |
[ 5.0% - 5.5% ] 5.35% | 56,948 | 4.1% |
[ 5.5% - 6.0% ] 5.51% | 744 | 2.4% |
[ 6.0% - 6.5% ] 6.02% | 1,280 | 2.8% |
[ 6.5% - 7.0% ] 6.57% | 4,463 | 7.2% |
[ 6.5% - 7.0% ] 6.60% | 3,639 | 3.0% |
[ 7.0% - 7.5% ] 7.03% | 12,559 | 2.9% |
[ 7.0% - 7.5% ] 7.10% | 12,442 | 3.0% |