Irish Married-Couple Family Poverty
COMPARE
Irish
Select to Compare
Married-Couple Family Poverty
Irish Married-Couple Family Poverty
4.2%
POVERTY | MARRIED-COUPLE FAMILIES
99.9/ 100
METRIC RATING
33rd/ 347
METRIC RANK
Irish Married-Couple Family Poverty Correlation Chart
The statistical analysis conducted on geographies consisting of 563,529,593 people shows a strong positive correlation between the proportion of Irish and poverty level among married-couple families in the United States with a correlation coefficient (R) of 0.712 and weighted average of 4.2%. On average, for every 1% (one percent) increase in Irish within a typical geography, there is an increase of 0.69% in poverty level among married-couple families.
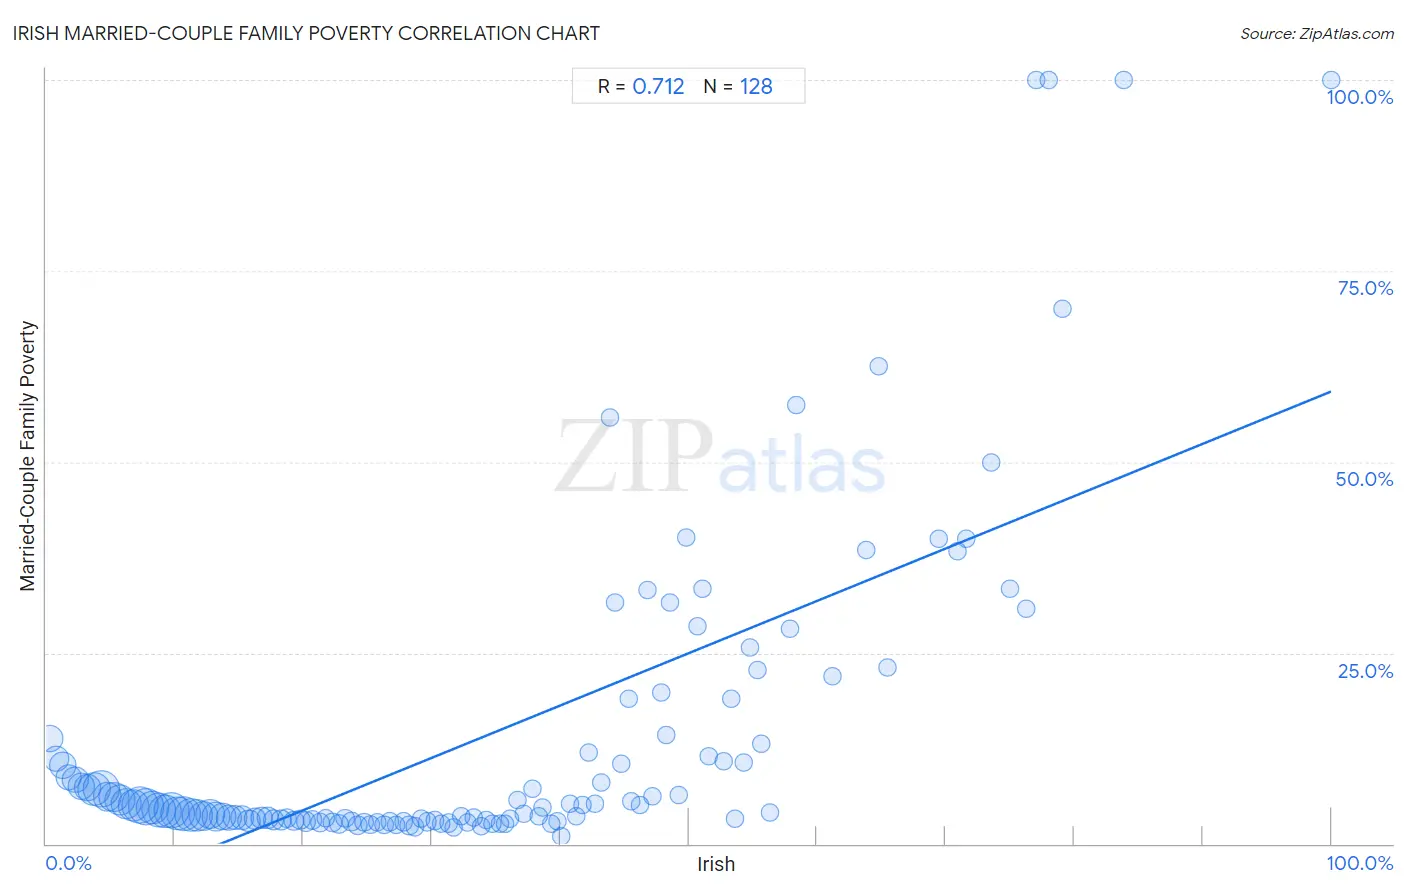
It is essential to understand that the correlation between the percentage of Irish and poverty level among married-couple families does not imply a direct cause-and-effect relationship. It remains uncertain whether the presence of Irish influences an upward or downward trend in the level of poverty level among married-couple families within an area, or if Irish simply ended up residing in those areas with higher or lower levels of poverty level among married-couple families due to other factors.
Demographics Similar to Irish by Married-Couple Family Poverty
In terms of married-couple family poverty, the demographic groups most similar to Irish are Dutch (4.2%, a difference of 0.23%), Greek (4.2%, a difference of 0.48%), Estonian (4.2%, a difference of 0.59%), Finnish (4.2%, a difference of 0.67%), and European (4.2%, a difference of 0.80%).
| Demographics | Rating | Rank | Married-Couple Family Poverty |
| Cypriots | 99.9 /100 | #26 | Exceptional 4.1% |
| Danes | 99.9 /100 | #27 | Exceptional 4.1% |
| Scandinavians | 99.9 /100 | #28 | Exceptional 4.1% |
| Immigrants from Scotland | 99.9 /100 | #29 | Exceptional 4.2% |
| Finns | 99.9 /100 | #30 | Exceptional 4.2% |
| Estonians | 99.9 /100 | #31 | Exceptional 4.2% |
| Greeks | 99.9 /100 | #32 | Exceptional 4.2% |
| Irish | 99.9 /100 | #33 | Exceptional 4.2% |
| Dutch | 99.9 /100 | #34 | Exceptional 4.2% |
| Europeans | 99.9 /100 | #35 | Exceptional 4.2% |
| English | 99.9 /100 | #36 | Exceptional 4.2% |
| Iranians | 99.9 /100 | #37 | Exceptional 4.2% |
| Belgians | 99.9 /100 | #38 | Exceptional 4.2% |
| Immigrants from Northern Europe | 99.8 /100 | #39 | Exceptional 4.2% |
| French Canadians | 99.8 /100 | #40 | Exceptional 4.2% |
Irish Married-Couple Family Poverty Correlation Summary
| Measurement | Irish Data | Married-Couple Family Poverty Data |
| Minimum | 0.26% | 0.92% |
| Maximum | 100.0% | 100.0% |
| Range | 99.7% | 99.1% |
| Mean | 33.7% | 13.8% |
| Median | 32.0% | 4.6% |
| Interquartile 25% (IQ1) | 16.0% | 3.1% |
| Interquartile 75% (IQ3) | 48.1% | 12.5% |
| Interquartile Range (IQR) | 32.1% | 9.4% |
| Standard Deviation (Sample) | 21.7% | 20.9% |
| Standard Deviation (Population) | 21.6% | 20.8% |
Correlation Details
| Irish Percentile | Sample Size | Married-Couple Family Poverty |
[ 0.0% - 0.5% ] 0.26% | 12,451,864 | 13.7% |
[ 0.5% - 1.0% ] 0.73% | 10,271,577 | 11.1% |
[ 1.0% - 1.5% ] 1.26% | 11,096,934 | 10.3% |
[ 1.5% - 2.0% ] 1.76% | 10,482,230 | 8.7% |
[ 2.0% - 2.5% ] 2.26% | 10,922,642 | 8.4% |
[ 2.5% - 3.0% ] 2.74% | 11,826,131 | 7.5% |
[ 3.0% - 3.5% ] 3.25% | 11,698,404 | 7.3% |
[ 3.5% - 4.0% ] 3.71% | 19,636,817 | 7.1% |
[ 4.0% - 4.5% ] 4.30% | 25,187,901 | 7.2% |
[ 4.5% - 5.0% ] 4.74% | 14,082,900 | 6.1% |
[ 5.0% - 5.5% ] 5.24% | 16,580,249 | 6.1% |
[ 5.5% - 6.0% ] 5.74% | 17,122,210 | 5.7% |
[ 6.0% - 6.5% ] 6.25% | 17,178,877 | 5.3% |
[ 6.5% - 7.0% ] 6.76% | 17,666,357 | 5.0% |
[ 7.0% - 7.5% ] 7.25% | 25,473,874 | 5.1% |
[ 7.5% - 8.0% ] 7.75% | 24,134,163 | 4.9% |
[ 8.0% - 8.5% ] 8.26% | 20,258,663 | 4.8% |
[ 8.5% - 9.0% ] 8.73% | 22,207,704 | 4.5% |
[ 9.0% - 9.5% ] 9.25% | 20,146,086 | 4.2% |
[ 9.5% - 10.0% ] 9.75% | 23,204,127 | 4.4% |
[ 10.0% - 10.5% ] 10.24% | 21,511,233 | 4.0% |
[ 10.5% - 11.0% ] 10.74% | 22,236,668 | 4.0% |
[ 11.0% - 11.5% ] 11.26% | 20,649,308 | 3.8% |
[ 11.5% - 12.0% ] 11.76% | 17,632,985 | 3.7% |
[ 12.0% - 12.5% ] 12.22% | 15,986,217 | 3.6% |
[ 12.5% - 13.0% ] 12.76% | 14,740,488 | 3.9% |
[ 13.0% - 13.5% ] 13.24% | 14,285,105 | 3.6% |
[ 13.5% - 14.0% ] 13.74% | 11,254,320 | 3.6% |
[ 14.0% - 14.5% ] 14.24% | 9,810,312 | 3.4% |
[ 14.5% - 15.0% ] 14.74% | 8,485,785 | 3.4% |
[ 15.0% - 15.5% ] 15.24% | 7,845,515 | 3.4% |
[ 15.5% - 16.0% ] 15.75% | 6,324,339 | 3.0% |
[ 16.0% - 16.5% ] 16.25% | 5,190,837 | 3.3% |
[ 16.5% - 17.0% ] 16.74% | 4,117,866 | 3.4% |
[ 17.0% - 17.5% ] 17.25% | 4,169,567 | 3.4% |
[ 17.5% - 18.0% ] 17.73% | 3,751,439 | 3.1% |
[ 18.0% - 18.5% ] 18.25% | 3,386,498 | 3.0% |
[ 18.5% - 19.0% ] 18.74% | 3,159,318 | 3.3% |
[ 19.0% - 19.5% ] 19.27% | 2,821,382 | 3.0% |
[ 19.5% - 20.0% ] 19.76% | 2,633,500 | 3.1% |
[ 20.0% - 20.5% ] 20.22% | 2,455,218 | 2.9% |
[ 20.5% - 21.0% ] 20.74% | 1,829,999 | 3.0% |
[ 21.0% - 21.5% ] 21.26% | 1,641,446 | 2.8% |
[ 21.5% - 22.0% ] 21.74% | 1,551,424 | 3.3% |
[ 22.0% - 22.5% ] 22.27% | 1,851,130 | 2.8% |
[ 22.5% - 23.0% ] 22.75% | 1,273,464 | 2.6% |
[ 23.0% - 23.5% ] 23.27% | 1,260,925 | 3.3% |
[ 23.5% - 24.0% ] 23.77% | 930,030 | 2.9% |
[ 24.0% - 24.5% ] 24.26% | 1,021,646 | 2.4% |
[ 24.5% - 25.0% ] 24.72% | 737,302 | 2.8% |
[ 25.0% - 25.5% ] 25.24% | 950,040 | 2.5% |
[ 25.5% - 26.0% ] 25.76% | 703,468 | 2.8% |
[ 26.0% - 26.5% ] 26.30% | 622,117 | 2.5% |
[ 26.5% - 27.0% ] 26.76% | 438,178 | 2.9% |
[ 27.0% - 27.5% ] 27.22% | 427,828 | 2.5% |
[ 27.5% - 28.0% ] 27.81% | 430,726 | 2.9% |
[ 28.0% - 28.5% ] 28.24% | 520,707 | 2.4% |
[ 28.5% - 29.0% ] 28.71% | 414,364 | 2.2% |
[ 29.0% - 29.5% ] 29.21% | 310,531 | 3.3% |
[ 29.5% - 30.0% ] 29.68% | 402,496 | 2.9% |
[ 30.0% - 30.5% ] 30.25% | 232,650 | 3.0% |
[ 30.5% - 31.0% ] 30.70% | 229,843 | 2.6% |
[ 31.0% - 31.5% ] 31.35% | 201,007 | 2.7% |
[ 31.5% - 32.0% ] 31.72% | 307,769 | 2.1% |
[ 32.0% - 32.5% ] 32.28% | 136,069 | 3.6% |
[ 32.5% - 33.0% ] 32.80% | 119,974 | 2.7% |
[ 33.0% - 33.5% ] 33.25% | 78,940 | 3.4% |
[ 33.5% - 34.0% ] 33.83% | 124,367 | 2.4% |
[ 34.0% - 34.5% ] 34.21% | 60,123 | 3.1% |
[ 34.5% - 35.0% ] 34.75% | 111,421 | 2.6% |
[ 35.0% - 35.5% ] 35.28% | 90,688 | 2.6% |
[ 35.5% - 36.0% ] 35.71% | 24,371 | 2.6% |
[ 36.0% - 36.5% ] 36.10% | 68,218 | 3.3% |
[ 36.5% - 37.0% ] 36.70% | 20,894 | 5.7% |
[ 37.0% - 37.5% ] 37.12% | 35,037 | 3.9% |
[ 37.5% - 38.0% ] 37.80% | 14,244 | 7.2% |
[ 38.0% - 38.5% ] 38.29% | 36,980 | 3.6% |
[ 38.5% - 39.0% ] 38.62% | 29,808 | 4.8% |
[ 39.0% - 39.5% ] 39.31% | 67,791 | 2.6% |
[ 39.5% - 40.0% ] 39.75% | 33,316 | 3.0% |
[ 40.0% - 40.5% ] 40.03% | 20,015 | 0.92% |
[ 40.5% - 41.0% ] 40.79% | 4,653 | 5.3% |
[ 41.0% - 41.5% ] 41.26% | 16,720 | 3.6% |
[ 41.5% - 42.0% ] 41.76% | 16,932 | 5.1% |
[ 42.0% - 42.5% ] 42.18% | 1,669 | 11.9% |
[ 42.5% - 43.0% ] 42.66% | 4,046 | 5.2% |
[ 43.0% - 43.5% ] 43.24% | 8,044 | 8.0% |
[ 43.5% - 44.0% ] 43.84% | 219 | 55.8% |
[ 44.0% - 44.5% ] 44.22% | 1,262 | 31.6% |
[ 44.5% - 45.0% ] 44.73% | 4,415 | 10.5% |
[ 45.0% - 45.5% ] 45.31% | 2,909 | 19.0% |
[ 45.5% - 46.0% ] 45.54% | 650 | 5.6% |
[ 46.0% - 46.5% ] 46.22% | 1,679 | 5.1% |
[ 46.5% - 47.0% ] 46.82% | 314 | 33.2% |
[ 47.0% - 47.5% ] 47.19% | 10,126 | 6.2% |
[ 47.5% - 48.0% ] 47.90% | 428 | 19.8% |
[ 48.0% - 48.5% ] 48.29% | 1,317 | 14.2% |
[ 48.5% - 49.0% ] 48.57% | 455 | 31.5% |
[ 49.0% - 49.5% ] 49.21% | 191 | 6.3% |
[ 49.5% - 50.0% ] 49.78% | 677 | 40.1% |
[ 50.5% - 51.0% ] 50.67% | 2,163 | 28.4% |
[ 51.0% - 51.5% ] 51.11% | 45 | 33.3% |
[ 51.5% - 52.0% ] 51.58% | 95 | 11.5% |
[ 52.5% - 53.0% ] 52.68% | 1,511 | 10.8% |
[ 53.0% - 53.5% ] 53.27% | 1,485 | 19.0% |
[ 53.5% - 54.0% ] 53.63% | 248 | 3.3% |
[ 54.0% - 54.5% ] 54.30% | 547 | 10.6% |
[ 54.5% - 55.0% ] 54.73% | 201 | 25.6% |
[ 55.0% - 55.5% ] 55.35% | 1,438 | 22.7% |
[ 55.5% - 56.0% ] 55.69% | 756 | 13.1% |
[ 56.0% - 56.5% ] 56.29% | 302 | 4.2% |
[ 57.5% - 58.0% ] 57.87% | 731 | 28.1% |
[ 58.0% - 58.5% ] 58.33% | 120 | 57.4% |
[ 61.0% - 61.5% ] 61.17% | 958 | 21.9% |
[ 63.5% - 64.0% ] 63.81% | 561 | 38.5% |
[ 64.5% - 65.0% ] 64.81% | 54 | 62.5% |
[ 65.0% - 65.5% ] 65.45% | 55 | 23.1% |
[ 69.0% - 69.5% ] 69.43% | 157 | 40.0% |
[ 70.5% - 71.0% ] 70.87% | 690 | 38.2% |
[ 71.5% - 72.0% ] 71.63% | 141 | 40.0% |
[ 73.5% - 74.0% ] 73.56% | 329 | 50.0% |
[ 75.0% - 75.5% ] 75.00% | 64 | 33.3% |
[ 76.0% - 76.5% ] 76.26% | 796 | 30.8% |
[ 77.0% - 77.5% ] 77.01% | 174 | 100.0% |
[ 78.0% - 78.5% ] 78.05% | 82 | 100.0% |
[ 79.0% - 79.5% ] 79.12% | 182 | 70.0% |
[ 83.5% - 84.0% ] 83.87% | 31 | 100.0% |
[ 99.5% - 100.0% ] 100.00% | 15 | 100.0% |