Northern European Married-Couple Family Poverty

COMPARE

Northern European
Race
Ancestry
AfghanAfricanAlaska NativeAlaskan AthabascanAlbanianAleutAlsatianAmericanApacheArabArapahoArgentineanArmenianAssyrian/Chaldean/SyriacAustralianAustrianBahamianBangladeshiBarbadianBasqueBelgianBelizeanBermudanBhutaneseBlackfeetBolivianBrazilianBritishBritish West IndianBulgarianBurmeseCajunCambodianCanadianCape VerdeanCarpatho RusynCelticCentral AmericanCentral American IndianCherokeeCheyenneChickasawChileanChineseChippewaChoctawColombianColvilleComancheCosta RicanCreeCreekCroatianCrowCubanCypriotCzechCzechoslovakianDanishDelawareDominicanDutchDutch West IndianEastern EuropeanEcuadorianEgyptianEnglishEstonianEthiopianEuropeanFijianFilipinoFinnishFrenchFrench American IndianFrench CanadianGermanGerman RussianGhanaianGreekGuamanian/ChamorroGuatemalanGuyaneseHaitianHmongHonduranHopiHoumaHungarianIcelanderIndian (Asian)IndonesianInupiatIranianIraqiIrishIroquoisIsraeliItalianJamaicanJapaneseJordanianKenyanKiowaKoreanLaotianLatvianLebaneseLiberianLithuanianLumbeeLuxembourgerMacedonianMalaysianMalteseMarshalleseMenomineeMexicanMexican American IndianMongolianMoroccanNative HawaiianNavajoNepaleseNew ZealanderNicaraguanNigerianNorthern EuropeanNorwegianOkinawanOsageOttawaPaiutePakistaniPalestinianPanamanianParaguayanPennsylvania GermanPeruvianPimaPolishPortuguesePotawatomiPuebloPuerto RicanPuget Sound SalishRomanianRussianSalvadoranSamoanScandinavianScotch-IrishScottishSeminoleSenegaleseSerbianShoshoneSierra LeoneanSiouxSlavicSlovakSloveneSomaliSouth AfricanSouth AmericanSouth American IndianSoviet UnionSpaniardSpanishSpanish AmericanSpanish American IndianSri LankanSubsaharan AfricanSudaneseSwedishSwissSyrianTaiwaneseThaiTlingit-HaidaTohono O'OdhamTonganTrinidadian and TobagonianTsimshianTurkishU.S. Virgin IslanderUgandanUkrainianUruguayanUteVenezuelanVietnameseWelshWest IndianYakamaYaquiYugoslavianYumanYup'ikZimbabwean
Immigration
NonimmigrantsImmigrantsAfghanistanAfricaAlbaniaArgentinaArmeniaAsiaAustraliaAustriaBahamasBangladeshBarbadosBelarusBelgiumBelizeBoliviaBosnia and HerzegovinaBrazilBulgariaBurma/MyanmarCabo VerdeCambodiaCameroonCanadaCaribbeanCentral AmericaChileChinaColombiaCongoCosta RicaCroatiaCubaCzechoslovakiaDenmarkDominicaDominican RepublicEastern AfricaEastern AsiaEastern EuropeEcuadorEgyptEl SalvadorEnglandEritreaEthiopiaEuropeFijiFranceGermanyGhanaGreeceGrenadaGuatemalaGuyanaHaitiHondurasHong KongHungaryIndiaIndonesiaIranIraqIrelandIsraelItalyJamaicaJapanJordanKazakhstanKenyaKoreaKuwaitLaosLatin AmericaLatviaLebanonLiberiaLithuaniaMalaysiaMexicoMicronesiaMiddle AfricaMoldovaMoroccoNepalNetherlandsNicaraguaNigeriaNorth AmericaNorth MacedoniaNorthern AfricaNorthern EuropeNorwayOceaniaPakistanPanamaPeruPhilippinesPolandPortugalRomaniaRussiaSaudi ArabiaScotlandSenegalSerbiaSierra LeoneSingaporeSomaliaSouth AfricaSouth AmericaSouth Central AsiaSouth Eastern AsiaSouthern EuropeSpainSri LankaSt. Vincent and the GrenadinesSudanSwedenSwitzerlandSyriaTaiwanThailandTrinidad and TobagoTurkeyUgandaUkraineUruguayUzbekistanVenezuelaVietnamWest IndiesWestern AfricaWestern AsiaWestern EuropeYemenZaireZimbabweAzores
Select to Compare
Race
Ancestry
AfghanAfricanAlaska NativeAlaskan AthabascanAlbanianAleutAlsatianAmericanApacheArabArapahoArgentineanArmenianAssyrian/Chaldean/SyriacAustralianAustrianBahamianBangladeshiBarbadianBasqueBelgianBelizeanBermudanBhutaneseBlackfeetBolivianBrazilianBritishBritish West IndianBulgarianBurmeseCajunCambodianCanadianCape VerdeanCarpatho RusynCelticCentral AmericanCentral American IndianCherokeeCheyenneChickasawChileanChineseChippewaChoctawColombianColvilleComancheCosta RicanCreeCreekCroatianCrowCubanCypriotCzechCzechoslovakianDanishDelawareDominicanDutchDutch West IndianEastern EuropeanEcuadorianEgyptianEnglishEstonianEthiopianEuropeanFijianFilipinoFinnishFrenchFrench American IndianFrench CanadianGermanGerman RussianGhanaianGreekGuamanian/ChamorroGuatemalanGuyaneseHaitianHmongHonduranHopiHoumaHungarianIcelanderIndian (Asian)IndonesianInupiatIranianIraqiIrishIroquoisIsraeliItalianJamaicanJapaneseJordanianKenyanKiowaKoreanLaotianLatvianLebaneseLiberianLithuanianLumbeeLuxembourgerMacedonianMalaysianMalteseMarshalleseMenomineeMexicanMexican American IndianMongolianMoroccanNative HawaiianNavajoNepaleseNew ZealanderNicaraguanNigerianNorwegianOkinawanOsageOttawaPaiutePakistaniPalestinianPanamanianParaguayanPennsylvania GermanPeruvianPimaPolishPortuguesePotawatomiPuebloPuerto RicanPuget Sound SalishRomanianRussianSalvadoranSamoanScandinavianScotch-IrishScottishSeminoleSenegaleseSerbianShoshoneSierra LeoneanSiouxSlavicSlovakSloveneSomaliSouth AfricanSouth AmericanSouth American IndianSoviet UnionSpaniardSpanishSpanish AmericanSpanish American IndianSri LankanSubsaharan AfricanSudaneseSwedishSwissSyrianTaiwaneseThaiTlingit-HaidaTohono O'OdhamTonganTrinidadian and TobagonianTsimshianTurkishU.S. Virgin IslanderUgandanUkrainianUruguayanUteVenezuelanVietnameseWelshWest IndianYakamaYaquiYugoslavianYumanYup'ikZimbabwean
Immigration
NonimmigrantsImmigrantsAfghanistanAfricaAlbaniaArgentinaArmeniaAsiaAustraliaAustriaBahamasBangladeshBarbadosBelarusBelgiumBelizeBoliviaBosnia and HerzegovinaBrazilBulgariaBurma/MyanmarCabo VerdeCambodiaCameroonCanadaCaribbeanCentral AmericaChileChinaColombiaCongoCosta RicaCroatiaCubaCzechoslovakiaDenmarkDominicaDominican RepublicEastern AfricaEastern AsiaEastern EuropeEcuadorEgyptEl SalvadorEnglandEritreaEthiopiaEuropeFijiFranceGermanyGhanaGreeceGrenadaGuatemalaGuyanaHaitiHondurasHong KongHungaryIndiaIndonesiaIranIraqIrelandIsraelItalyJamaicaJapanJordanKazakhstanKenyaKoreaKuwaitLaosLatin AmericaLatviaLebanonLiberiaLithuaniaMalaysiaMexicoMicronesiaMiddle AfricaMoldovaMoroccoNepalNetherlandsNicaraguaNigeriaNorth AmericaNorth MacedoniaNorthern AfricaNorthern EuropeNorwayOceaniaPakistanPanamaPeruPhilippinesPolandPortugalRomaniaRussiaSaudi ArabiaScotlandSenegalSerbiaSierra LeoneSingaporeSomaliaSouth AfricaSouth AmericaSouth Central AsiaSouth Eastern AsiaSouthern EuropeSpainSri LankaSt. Vincent and the GrenadinesSudanSwedenSwitzerlandSyriaTaiwanThailandTrinidad and TobagoTurkeyUgandaUkraineUruguayUzbekistanVenezuelaVietnamWest IndiesWestern AfricaWestern AsiaWestern EuropeYemenZaireZimbabweAzores
Married-Couple Family Poverty
Income
Poverty
Unemployment
Labor Participation
Family Structure
Vehicle Availability
Education Level
Disability

Northern European Married-Couple Family Poverty
Exceptional

4.3%
POVERTY | MARRIED-COUPLE FAMILIES
99.8/ 100
METRIC RATING
41st/ 347
METRIC RANK

Northern European Married-Couple Family Poverty Correlation Chart

The statistical analysis conducted on geographies consisting of 401,488,886 people shows a strong positive correlation between the proportion of Northern Europeans and poverty level among married-couple families in the United States with a correlation coefficient (R) of 0.747 and weighted average of 4.3%. On average, for every 1% (one percent) increase in Northern Europeans within a typical geography, there is an increase of 1.3% in poverty level among married-couple families.
Northern European Married-Couple Family Poverty
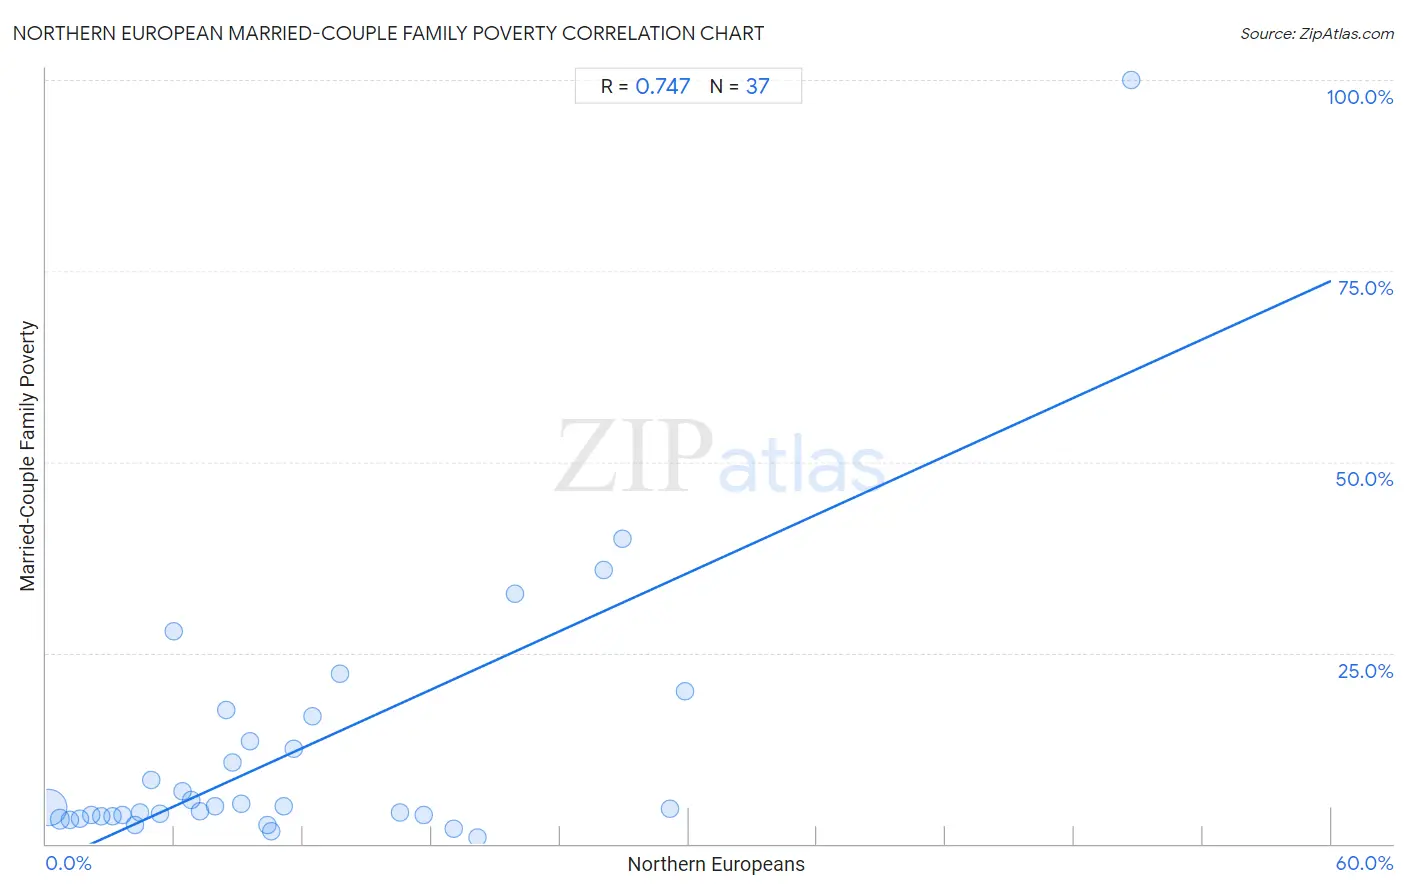
It is essential to understand that the correlation between the percentage of Northern Europeans and poverty level among married-couple families does not imply a direct cause-and-effect relationship. It remains uncertain whether the presence of Northern Europeans influences an upward or downward trend in the level of poverty level among married-couple families within an area, or if Northern Europeans simply ended up residing in those areas with higher or lower levels of poverty level among married-couple families due to other factors.

Demographics Similar to Northern Europeans by Married-Couple Family Poverty

In terms of married-couple family poverty, the demographic groups most similar to Northern Europeans are Scottish (4.3%, a difference of 0.16%), French Canadian (4.2%, a difference of 0.25%), Immigrants from Northern Europe (4.2%, a difference of 0.53%), Swiss (4.3%, a difference of 0.60%), and Belgian (4.2%, a difference of 0.66%).
DemographicsRating | RankMarried-Couple Family Poverty
Dutch
99.9
/100
|
#34
Exceptional
4.2%
Europeans
99.9
/100
|
#35
Exceptional
4.2%
English
99.9
/100
|
#36
Exceptional
4.2%
Iranians
99.9
/100
|
#37
Exceptional
4.2%
Belgians
99.9
/100
|
#38
Exceptional
4.2%
Immigrants from Northern Europe
99.8
/100
|
#39
Exceptional
4.2%
French Canadians
99.8
/100
|
#40
Exceptional
4.2%
Northern Europeans
99.8
/100
|
#41
Exceptional
4.3%
Scottish
99.8
/100
|
#42
Exceptional
4.3%
Swiss
99.8
/100
|
#43
Exceptional
4.3%
Immigrants from Japan
99.8
/100
|
#44
Exceptional
4.3%
Serbians
99.8
/100
|
#45
Exceptional
4.3%
British
99.8
/100
|
#46
Exceptional
4.3%
Immigrants from South Central Asia
99.8
/100
|
#47
Exceptional
4.3%
Australians
99.7
/100
|
#48
Exceptional
4.3%

Northern European Married-Couple Family Poverty Correlation Summary

MeasurementNorthern European DataMarried-Couple Family Poverty Data
Minimum0.14%0.82%
Maximum50.6%100.0%
Range50.5%99.2%
Mean11.6%12.1%
Median8.7%4.8%
Interquartile 25% (IQ1)4.2%3.6%
Interquartile 75% (IQ3)17.1%15.0%
Interquartile Range (IQR)12.8%11.4%
Standard Deviation (Sample)10.6%18.0%
Standard Deviation (Population)10.4%17.8%

Correlation Details

Northern European PercentileSample SizeMarried-Couple Family Poverty
[
0.0%
-
0.5%
]
0.14%
363,937,6144.8%
[
0.5%
-
1.0%
]
0.64%
30,277,7713.2%
[
1.0%
-
1.5%
]
1.11%
4,642,0563.1%
[
1.5%
-
2.0%
]
1.60%
1,573,9913.3%
[
2.0%
-
2.5%
]
2.10%
424,9513.7%
[
2.5%
-
3.0%
]
2.56%
193,7713.7%
[
3.0%
-
3.5%
]
3.08%
130,5273.5%
[
3.5%
-
4.0%
]
3.54%
119,9203.7%
[
4.0%
-
4.5%
]
4.12%
77,8472.4%
[
4.0%
-
4.5%
]
4.36%
15,8084.1%
[
4.5%
-
5.0%
]
4.91%
31,9378.4%
[
5.0%
-
5.5%
]
5.33%
20,6244.0%
[
5.5%
-
6.0%
]
5.93%
3,07127.7%
[
6.0%
-
6.5%
]
6.34%
3,5816.9%
[
6.5%
-
7.0%
]
6.80%
6,4885.8%
[
7.0%
-
7.5%
]
7.16%
4,5364.2%
[
7.5%
-
8.0%
]
7.88%
1,1294.9%
[
8.0%
-
8.5%
]
8.42%
3,26717.6%
[
8.5%
-
9.0%
]
8.70%
2,44910.7%
[
9.0%
-
9.5%
]
9.09%
2,3885.2%
[
9.5%
-
10.0%
]
9.52%
74613.4%
[
10.0%
-
10.5%
]
10.30%
3302.5%
[
10.5%
-
11.0%
]
10.53%
2,7441.7%
[
11.0%
-
11.5%
]
11.09%
2,4795.0%
[
11.5%
-
12.0%
]
11.58%
2,30512.5%
[
12.0%
-
12.5%
]
12.41%
1,52316.6%
[
13.5%
-
14.0%
]
13.73%
10222.2%
[
16.5%
-
17.0%
]
16.53%
8654.1%
[
17.5%
-
18.0%
]
17.61%
1,1983.8%
[
19.0%
-
19.5%
]
19.01%
4842.0%
[
20.0%
-
20.5%
]
20.14%
4220.82%
[
21.5%
-
22.0%
]
21.89%
23332.8%
[
26.0%
-
26.5%
]
26.05%
90635.8%
[
26.5%
-
27.0%
]
26.92%
7840.0%
[
29.0%
-
29.5%
]
29.11%
3164.5%
[
29.5%
-
30.0%
]
29.83%
35220.0%
[
50.5%
-
51.0%
]
50.65%
77100.0%