Italian Married-Couple Family Poverty
COMPARE
Italian
Select to Compare
Married-Couple Family Poverty
Italian Married-Couple Family Poverty
4.0%
POVERTY | MARRIED-COUPLE FAMILIES
100.0/ 100
METRIC RATING
18th/ 347
METRIC RANK
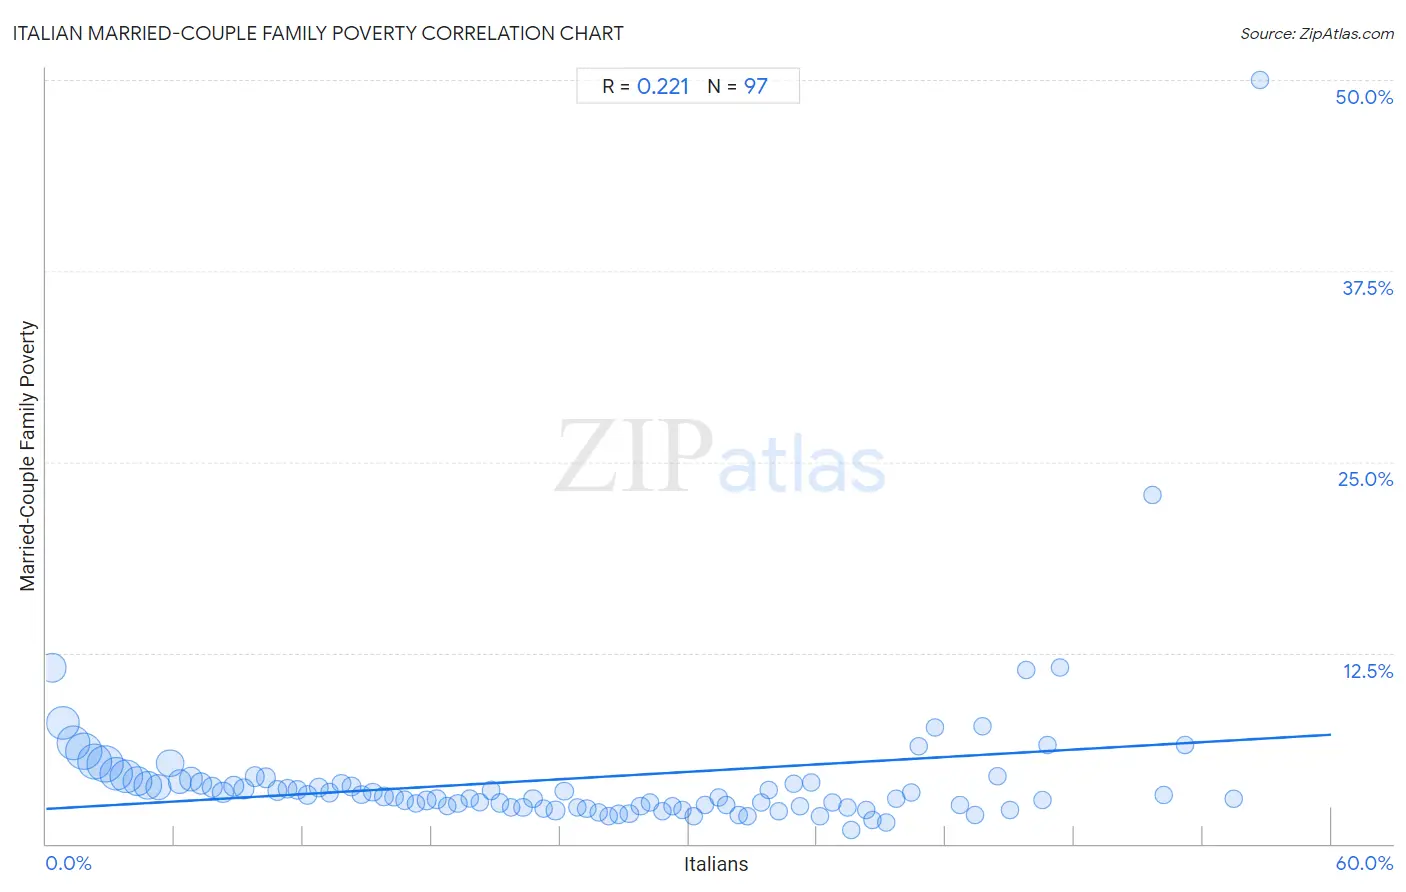
Italian Married-Couple Family Poverty Correlation Chart
The statistical analysis conducted on geographies consisting of 559,685,630 people shows a weak positive correlation between the proportion of Italians and poverty level among married-couple families in the United States with a correlation coefficient (R) of 0.221 and weighted average of 4.0%. On average, for every 1% (one percent) increase in Italians within a typical geography, there is an increase of 0.081% in poverty level among married-couple families.
It is essential to understand that the correlation between the percentage of Italians and poverty level among married-couple families does not imply a direct cause-and-effect relationship. It remains uncertain whether the presence of Italians influences an upward or downward trend in the level of poverty level among married-couple families within an area, or if Italians simply ended up residing in those areas with higher or lower levels of poverty level among married-couple families due to other factors.
Demographics Similar to Italians by Married-Couple Family Poverty
In terms of married-couple family poverty, the demographic groups most similar to Italians are Filipino (4.0%, a difference of 0.010%), German (4.0%, a difference of 0.040%), Polish (4.0%, a difference of 0.31%), Slovak (4.0%, a difference of 0.34%), and Czech (4.0%, a difference of 0.38%).
| Demographics | Rating | Rank | Married-Couple Family Poverty |
| Lithuanians | 100.0 /100 | #11 | Exceptional 4.0% |
| Bulgarians | 100.0 /100 | #12 | Exceptional 4.0% |
| Czechs | 100.0 /100 | #13 | Exceptional 4.0% |
| Slovaks | 100.0 /100 | #14 | Exceptional 4.0% |
| Poles | 100.0 /100 | #15 | Exceptional 4.0% |
| Germans | 100.0 /100 | #16 | Exceptional 4.0% |
| Filipinos | 100.0 /100 | #17 | Exceptional 4.0% |
| Italians | 100.0 /100 | #18 | Exceptional 4.0% |
| Immigrants from Ireland | 99.9 /100 | #19 | Exceptional 4.1% |
| Maltese | 99.9 /100 | #20 | Exceptional 4.1% |
| Zimbabweans | 99.9 /100 | #21 | Exceptional 4.1% |
| Immigrants from Singapore | 99.9 /100 | #22 | Exceptional 4.1% |
| Bhutanese | 99.9 /100 | #23 | Exceptional 4.1% |
| Eastern Europeans | 99.9 /100 | #24 | Exceptional 4.1% |
| Immigrants from Taiwan | 99.9 /100 | #25 | Exceptional 4.1% |
Italian Married-Couple Family Poverty Correlation Summary
| Measurement | Italian Data | Married-Couple Family Poverty Data |
| Minimum | 0.27% | 0.87% |
| Maximum | 56.7% | 50.0% |
| Range | 56.4% | 49.1% |
| Mean | 24.7% | 4.3% |
| Median | 24.2% | 3.1% |
| Interquartile 25% (IQ1) | 12.0% | 2.4% |
| Interquartile 75% (IQ3) | 36.4% | 4.1% |
| Interquartile Range (IQR) | 24.5% | 1.6% |
| Standard Deviation (Sample) | 14.9% | 5.5% |
| Standard Deviation (Population) | 14.8% | 5.4% |
Correlation Details
| Italian Percentile | Sample Size | Married-Couple Family Poverty |
[ 0.0% - 0.5% ] 0.27% | 28,103,686 | 11.5% |
[ 0.5% - 1.0% ] 0.77% | 37,132,077 | 7.9% |
[ 1.0% - 1.5% ] 1.26% | 40,925,768 | 6.6% |
[ 1.5% - 2.0% ] 1.74% | 49,205,538 | 6.1% |
[ 2.0% - 2.5% ] 2.25% | 44,492,627 | 5.4% |
[ 2.5% - 3.0% ] 2.74% | 48,579,572 | 5.2% |
[ 3.0% - 3.5% ] 3.25% | 39,453,138 | 4.6% |
[ 3.5% - 4.0% ] 3.76% | 38,962,028 | 4.4% |
[ 4.0% - 4.5% ] 4.25% | 29,927,072 | 4.1% |
[ 4.5% - 5.0% ] 4.73% | 24,790,090 | 3.8% |
[ 5.0% - 5.5% ] 5.25% | 21,481,473 | 3.7% |
[ 5.5% - 6.0% ] 5.79% | 25,652,417 | 5.3% |
[ 6.0% - 6.5% ] 6.24% | 14,382,884 | 4.1% |
[ 6.5% - 7.0% ] 6.75% | 14,562,910 | 4.2% |
[ 7.0% - 7.5% ] 7.23% | 11,087,368 | 3.9% |
[ 7.5% - 8.0% ] 7.74% | 7,422,559 | 3.7% |
[ 8.0% - 8.5% ] 8.25% | 7,402,339 | 3.4% |
[ 8.5% - 9.0% ] 8.73% | 6,612,704 | 3.8% |
[ 9.0% - 9.5% ] 9.23% | 5,605,051 | 3.6% |
[ 9.5% - 10.0% ] 9.75% | 4,451,986 | 4.4% |
[ 10.0% - 10.5% ] 10.25% | 5,126,597 | 4.3% |
[ 10.5% - 11.0% ] 10.77% | 4,150,204 | 3.5% |
[ 11.0% - 11.5% ] 11.27% | 3,356,998 | 3.6% |
[ 11.5% - 12.0% ] 11.75% | 3,853,407 | 3.5% |
[ 12.0% - 12.5% ] 12.22% | 3,354,024 | 3.2% |
[ 12.5% - 13.0% ] 12.75% | 3,045,426 | 3.7% |
[ 13.0% - 13.5% ] 13.23% | 2,464,755 | 3.3% |
[ 13.5% - 14.0% ] 13.77% | 2,097,770 | 4.0% |
[ 14.0% - 14.5% ] 14.26% | 1,978,431 | 3.8% |
[ 14.5% - 15.0% ] 14.74% | 2,114,866 | 3.2% |
[ 15.0% - 15.5% ] 15.24% | 1,580,308 | 3.4% |
[ 15.5% - 16.0% ] 15.77% | 2,352,081 | 3.1% |
[ 16.0% - 16.5% ] 16.25% | 1,646,377 | 3.0% |
[ 16.5% - 17.0% ] 16.74% | 1,969,243 | 2.8% |
[ 17.0% - 17.5% ] 17.25% | 1,554,814 | 2.6% |
[ 17.5% - 18.0% ] 17.77% | 1,320,780 | 2.8% |
[ 18.0% - 18.5% ] 18.23% | 917,203 | 2.9% |
[ 18.5% - 19.0% ] 18.74% | 1,189,361 | 2.5% |
[ 19.0% - 19.5% ] 19.22% | 1,444,564 | 2.6% |
[ 19.5% - 20.0% ] 19.77% | 1,292,937 | 3.0% |
[ 20.0% - 20.5% ] 20.25% | 1,180,307 | 2.7% |
[ 20.5% - 21.0% ] 20.75% | 604,636 | 3.5% |
[ 21.0% - 21.5% ] 21.17% | 854,047 | 2.7% |
[ 21.5% - 22.0% ] 21.73% | 626,183 | 2.4% |
[ 22.0% - 22.5% ] 22.26% | 595,155 | 2.4% |
[ 22.5% - 23.0% ] 22.73% | 536,951 | 3.0% |
[ 23.0% - 23.5% ] 23.22% | 720,596 | 2.3% |
[ 23.5% - 24.0% ] 23.78% | 583,416 | 2.2% |
[ 24.0% - 24.5% ] 24.18% | 563,066 | 3.5% |
[ 24.5% - 25.0% ] 24.78% | 624,594 | 2.4% |
[ 25.0% - 25.5% ] 25.24% | 584,806 | 2.3% |
[ 25.5% - 26.0% ] 25.78% | 453,222 | 2.1% |
[ 26.0% - 26.5% ] 26.25% | 380,061 | 1.8% |
[ 26.5% - 27.0% ] 26.73% | 372,971 | 1.9% |
[ 27.0% - 27.5% ] 27.23% | 460,146 | 2.0% |
[ 27.5% - 28.0% ] 27.75% | 632,580 | 2.4% |
[ 28.0% - 28.5% ] 28.21% | 208,211 | 2.7% |
[ 28.5% - 29.0% ] 28.75% | 283,158 | 2.1% |
[ 29.0% - 29.5% ] 29.24% | 314,713 | 2.5% |
[ 29.5% - 30.0% ] 29.70% | 234,950 | 2.2% |
[ 30.0% - 30.5% ] 30.23% | 167,977 | 1.8% |
[ 30.5% - 31.0% ] 30.76% | 165,732 | 2.6% |
[ 31.0% - 31.5% ] 31.42% | 177,164 | 3.1% |
[ 31.5% - 32.0% ] 31.76% | 84,815 | 2.5% |
[ 32.0% - 32.5% ] 32.33% | 132,711 | 1.9% |
[ 32.5% - 33.0% ] 32.72% | 110,966 | 1.8% |
[ 33.0% - 33.5% ] 33.36% | 84,551 | 2.7% |
[ 33.5% - 34.0% ] 33.76% | 54,574 | 3.5% |
[ 34.0% - 34.5% ] 34.22% | 62,166 | 2.1% |
[ 34.5% - 35.0% ] 34.89% | 45,990 | 4.0% |
[ 35.0% - 35.5% ] 35.20% | 68,369 | 2.5% |
[ 35.5% - 36.0% ] 35.73% | 85,244 | 4.0% |
[ 36.0% - 36.5% ] 36.15% | 82,714 | 1.8% |
[ 36.5% - 37.0% ] 36.74% | 73,433 | 2.7% |
[ 37.0% - 37.5% ] 37.42% | 64,152 | 2.3% |
[ 37.5% - 38.0% ] 37.60% | 9,733 | 0.87% |
[ 38.0% - 38.5% ] 38.29% | 37,519 | 2.2% |
[ 38.5% - 39.0% ] 38.60% | 5,013 | 1.5% |
[ 39.0% - 39.5% ] 39.21% | 38,706 | 1.4% |
[ 39.5% - 40.0% ] 39.70% | 87,742 | 3.0% |
[ 40.0% - 40.5% ] 40.36% | 30,233 | 3.4% |
[ 40.5% - 41.0% ] 40.73% | 1,090 | 6.4% |
[ 41.5% - 42.0% ] 41.53% | 956 | 7.6% |
[ 42.5% - 43.0% ] 42.64% | 54,970 | 2.5% |
[ 43.0% - 43.5% ] 43.38% | 11,102 | 1.9% |
[ 43.5% - 44.0% ] 43.72% | 844 | 7.7% |
[ 44.0% - 44.5% ] 44.41% | 52,938 | 4.5% |
[ 44.5% - 45.0% ] 44.98% | 1,256 | 2.2% |
[ 45.5% - 46.0% ] 45.73% | 457 | 11.3% |
[ 46.0% - 46.5% ] 46.49% | 14,898 | 2.9% |
[ 46.5% - 47.0% ] 46.77% | 2,367 | 6.5% |
[ 47.0% - 47.5% ] 47.31% | 520 | 11.5% |
[ 51.5% - 52.0% ] 51.63% | 153 | 22.9% |
[ 52.0% - 52.5% ] 52.16% | 8,114 | 3.2% |
[ 53.0% - 53.5% ] 53.17% | 7,723 | 6.4% |
[ 55.0% - 55.5% ] 55.42% | 1,476 | 2.9% |
[ 56.5% - 57.0% ] 56.67% | 60 | 50.0% |