Paiute Married-Couple Family Poverty

COMPARE

Paiute
Race
Ancestry
AfghanAfricanAlaska NativeAlaskan AthabascanAlbanianAleutAlsatianAmericanApacheArabArapahoArgentineanArmenianAssyrian/Chaldean/SyriacAustralianAustrianBahamianBangladeshiBarbadianBasqueBelgianBelizeanBermudanBhutaneseBlackfeetBolivianBrazilianBritishBritish West IndianBulgarianBurmeseCajunCambodianCanadianCape VerdeanCarpatho RusynCelticCentral AmericanCentral American IndianCherokeeCheyenneChickasawChileanChineseChippewaChoctawColombianColvilleComancheCosta RicanCreeCreekCroatianCrowCubanCypriotCzechCzechoslovakianDanishDelawareDominicanDutchDutch West IndianEastern EuropeanEcuadorianEgyptianEnglishEstonianEthiopianEuropeanFijianFilipinoFinnishFrenchFrench American IndianFrench CanadianGermanGerman RussianGhanaianGreekGuamanian/ChamorroGuatemalanGuyaneseHaitianHmongHonduranHopiHoumaHungarianIcelanderIndian (Asian)IndonesianInupiatIranianIraqiIrishIroquoisIsraeliItalianJamaicanJapaneseJordanianKenyanKiowaKoreanLaotianLatvianLebaneseLiberianLithuanianLumbeeLuxembourgerMacedonianMalaysianMalteseMarshalleseMenomineeMexicanMexican American IndianMongolianMoroccanNative HawaiianNavajoNepaleseNew ZealanderNicaraguanNigerianNorthern EuropeanNorwegianOkinawanOsageOttawaPaiutePakistaniPalestinianPanamanianParaguayanPennsylvania GermanPeruvianPimaPolishPortuguesePotawatomiPuebloPuerto RicanPuget Sound SalishRomanianRussianSalvadoranSamoanScandinavianScotch-IrishScottishSeminoleSenegaleseSerbianShoshoneSierra LeoneanSiouxSlavicSlovakSloveneSomaliSouth AfricanSouth AmericanSouth American IndianSoviet UnionSpaniardSpanishSpanish AmericanSpanish American IndianSri LankanSubsaharan AfricanSudaneseSwedishSwissSyrianTaiwaneseThaiTlingit-HaidaTohono O'OdhamTonganTrinidadian and TobagonianTsimshianTurkishU.S. Virgin IslanderUgandanUkrainianUruguayanUteVenezuelanVietnameseWelshWest IndianYakamaYaquiYugoslavianYumanYup'ikZimbabwean
Immigration
NonimmigrantsImmigrantsAfghanistanAfricaAlbaniaArgentinaArmeniaAsiaAustraliaAustriaBahamasBangladeshBarbadosBelarusBelgiumBelizeBoliviaBosnia and HerzegovinaBrazilBulgariaBurma/MyanmarCabo VerdeCambodiaCameroonCanadaCaribbeanCentral AmericaChileChinaColombiaCongoCosta RicaCroatiaCubaCzechoslovakiaDenmarkDominicaDominican RepublicEastern AfricaEastern AsiaEastern EuropeEcuadorEgyptEl SalvadorEnglandEritreaEthiopiaEuropeFijiFranceGermanyGhanaGreeceGrenadaGuatemalaGuyanaHaitiHondurasHong KongHungaryIndiaIndonesiaIranIraqIrelandIsraelItalyJamaicaJapanJordanKazakhstanKenyaKoreaKuwaitLaosLatin AmericaLatviaLebanonLiberiaLithuaniaMalaysiaMexicoMicronesiaMiddle AfricaMoldovaMoroccoNepalNetherlandsNicaraguaNigeriaNorth AmericaNorth MacedoniaNorthern AfricaNorthern EuropeNorwayOceaniaPakistanPanamaPeruPhilippinesPolandPortugalRomaniaRussiaSaudi ArabiaScotlandSenegalSerbiaSierra LeoneSingaporeSomaliaSouth AfricaSouth AmericaSouth Central AsiaSouth Eastern AsiaSouthern EuropeSpainSri LankaSt. Vincent and the GrenadinesSudanSwedenSwitzerlandSyriaTaiwanThailandTrinidad and TobagoTurkeyUgandaUkraineUruguayUzbekistanVenezuelaVietnamWest IndiesWestern AfricaWestern AsiaWestern EuropeYemenZaireZimbabweAzores
Select to Compare
Race
Ancestry
AfghanAfricanAlaska NativeAlaskan AthabascanAlbanianAleutAlsatianAmericanApacheArabArapahoArgentineanArmenianAssyrian/Chaldean/SyriacAustralianAustrianBahamianBangladeshiBarbadianBasqueBelgianBelizeanBermudanBhutaneseBlackfeetBolivianBrazilianBritishBritish West IndianBulgarianBurmeseCajunCambodianCanadianCape VerdeanCarpatho RusynCelticCentral AmericanCentral American IndianCherokeeCheyenneChickasawChileanChineseChippewaChoctawColombianColvilleComancheCosta RicanCreeCreekCroatianCrowCubanCypriotCzechCzechoslovakianDanishDelawareDominicanDutchDutch West IndianEastern EuropeanEcuadorianEgyptianEnglishEstonianEthiopianEuropeanFijianFilipinoFinnishFrenchFrench American IndianFrench CanadianGermanGerman RussianGhanaianGreekGuamanian/ChamorroGuatemalanGuyaneseHaitianHmongHonduranHopiHoumaHungarianIcelanderIndian (Asian)IndonesianInupiatIranianIraqiIrishIroquoisIsraeliItalianJamaicanJapaneseJordanianKenyanKiowaKoreanLaotianLatvianLebaneseLiberianLithuanianLumbeeLuxembourgerMacedonianMalaysianMalteseMarshalleseMenomineeMexicanMexican American IndianMongolianMoroccanNative HawaiianNavajoNepaleseNew ZealanderNicaraguanNigerianNorthern EuropeanNorwegianOkinawanOsageOttawaPakistaniPalestinianPanamanianParaguayanPennsylvania GermanPeruvianPimaPolishPortuguesePotawatomiPuebloPuerto RicanPuget Sound SalishRomanianRussianSalvadoranSamoanScandinavianScotch-IrishScottishSeminoleSenegaleseSerbianShoshoneSierra LeoneanSiouxSlavicSlovakSloveneSomaliSouth AfricanSouth AmericanSouth American IndianSoviet UnionSpaniardSpanishSpanish AmericanSpanish American IndianSri LankanSubsaharan AfricanSudaneseSwedishSwissSyrianTaiwaneseThaiTlingit-HaidaTohono O'OdhamTonganTrinidadian and TobagonianTsimshianTurkishU.S. Virgin IslanderUgandanUkrainianUruguayanUteVenezuelanVietnameseWelshWest IndianYakamaYaquiYugoslavianYumanYup'ikZimbabwean
Immigration
NonimmigrantsImmigrantsAfghanistanAfricaAlbaniaArgentinaArmeniaAsiaAustraliaAustriaBahamasBangladeshBarbadosBelarusBelgiumBelizeBoliviaBosnia and HerzegovinaBrazilBulgariaBurma/MyanmarCabo VerdeCambodiaCameroonCanadaCaribbeanCentral AmericaChileChinaColombiaCongoCosta RicaCroatiaCubaCzechoslovakiaDenmarkDominicaDominican RepublicEastern AfricaEastern AsiaEastern EuropeEcuadorEgyptEl SalvadorEnglandEritreaEthiopiaEuropeFijiFranceGermanyGhanaGreeceGrenadaGuatemalaGuyanaHaitiHondurasHong KongHungaryIndiaIndonesiaIranIraqIrelandIsraelItalyJamaicaJapanJordanKazakhstanKenyaKoreaKuwaitLaosLatin AmericaLatviaLebanonLiberiaLithuaniaMalaysiaMexicoMicronesiaMiddle AfricaMoldovaMoroccoNepalNetherlandsNicaraguaNigeriaNorth AmericaNorth MacedoniaNorthern AfricaNorthern EuropeNorwayOceaniaPakistanPanamaPeruPhilippinesPolandPortugalRomaniaRussiaSaudi ArabiaScotlandSenegalSerbiaSierra LeoneSingaporeSomaliaSouth AfricaSouth AmericaSouth Central AsiaSouth Eastern AsiaSouthern EuropeSpainSri LankaSt. Vincent and the GrenadinesSudanSwedenSwitzerlandSyriaTaiwanThailandTrinidad and TobagoTurkeyUgandaUkraineUruguayUzbekistanVenezuelaVietnamWest IndiesWestern AfricaWestern AsiaWestern EuropeYemenZaireZimbabweAzores
Married-Couple Family Poverty
Income
Poverty
Unemployment
Labor Participation
Family Structure
Vehicle Availability
Education Level
Disability

Paiute Married-Couple Family Poverty
Good

8.3%
POVERTY | MARRIED-COUPLE FAMILIES
61.3/ 100
METRIC RATING
330th/ 347
METRIC RANK

Paiute Married-Couple Family Poverty Correlation Chart

The statistical analysis conducted on geographies consisting of 56,451,403 people shows a significant positive correlation between the proportion of Paiute and poverty level among married-couple families in the United States with a correlation coefficient (R) of 0.699 and weighted average of 8.3%. On average, for every 1% (one percent) increase in Paiute within a typical geography, there is an increase of 0.24% in poverty level among married-couple families.
Paiute Married-Couple Family Poverty
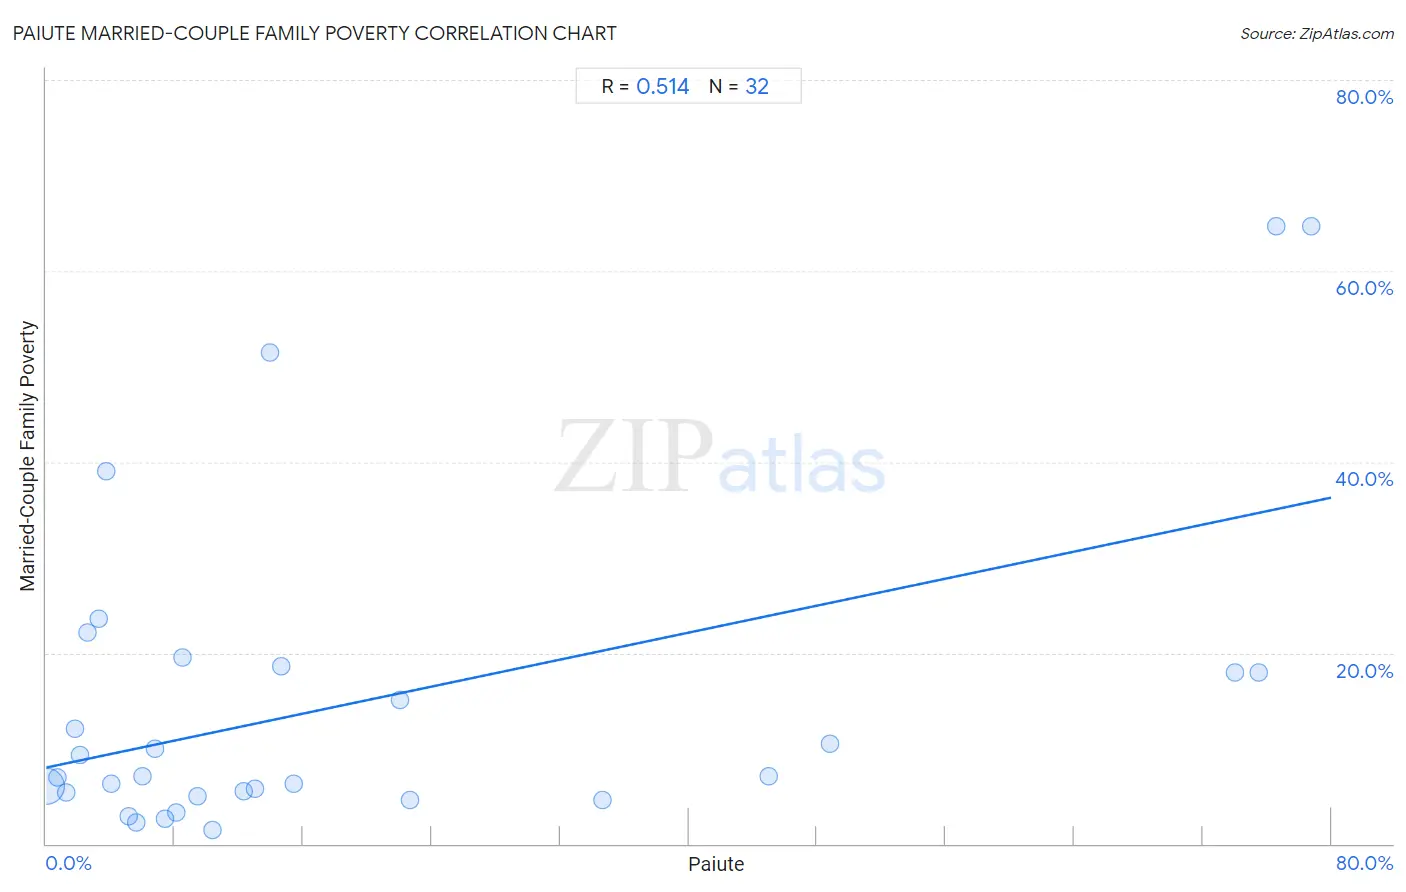
It is essential to understand that the correlation between the percentage of Paiute and poverty level among married-couple families does not imply a direct cause-and-effect relationship. It remains uncertain whether the presence of Paiute influences an upward or downward trend in the level of poverty level among married-couple families within an area, or if Paiute simply ended up residing in those areas with higher or lower levels of poverty level among married-couple families due to other factors.

Demographics Similar to Paiute by Married-Couple Family Poverty

In terms of married-couple family poverty, the demographic groups most similar to Paiute are Central American Indian (8.2%, a difference of 1.1%), Hopi (8.2%, a difference of 1.1%), Dominican (8.5%, a difference of 2.2%), Sioux (8.5%, a difference of 2.8%), and Native/Alaskan (8.6%, a difference of 3.4%).
DemographicsRating | RankMarried-Couple Family Poverty
Bangladeshis
66.0
/100
|
#323
Good
7.7%
Immigrants from Cuba
66.0
/100
|
#324
Good
7.7%
Immigrants from Mexico
65.4
/100
|
#325
Good
7.8%
Immigrants from Bangladesh
65.1
/100
|
#326
Good
7.8%
Inupiat
63.7
/100
|
#327
Good
8.0%
Hopi
62.1
/100
|
#328
Good
8.2%
Central American Indians
62.0
/100
|
#329
Good
8.2%
Paiute
61.3
/100
|
#330
Good
8.3%
Dominicans
59.8
/100
|
#331
Average
8.5%
Sioux
59.4
/100
|
#332
Average
8.5%
Natives/Alaskans
58.9
/100
|
#333
Average
8.6%
Cheyenne
58.6
/100
|
#334
Average
8.6%
Lumbee
58.6
/100
|
#335
Average
8.6%
Immigrants from Dominican Republic
58.3
/100
|
#336
Average
8.6%
Apache
56.9
/100
|
#337
Average
8.8%

Paiute Married-Couple Family Poverty Correlation Summary

MeasurementPaiute DataMarried-Couple Family Poverty Data
Minimum0.028%1.9%
Maximum81.9%33.3%
Range81.9%31.5%
Mean23.0%12.7%
Median8.7%9.2%
Interquartile 25% (IQ1)2.8%6.2%
Interquartile 75% (IQ3)39.0%18.9%
Interquartile Range (IQR)36.2%12.7%
Standard Deviation (Sample)27.0%9.1%
Standard Deviation (Population)26.5%8.9%

Correlation Details

Paiute PercentileSample SizeMarried-Couple Family Poverty
[
0.0%
-
0.5%
]
0.028%
55,386,4266.2%
[
0.5%
-
1.0%
]
0.57%
735,3987.3%
[
1.0%
-
1.5%
]
1.00%
152,5396.3%
[
1.0%
-
1.5%
]
1.33%
103,1736.6%
[
1.5%
-
2.0%
]
1.80%
10,9336.4%
[
2.0%
-
2.5%
]
2.28%
87724.0%
[
2.5%
-
3.0%
]
2.62%
10,9875.6%
[
3.0%
-
3.5%
]
3.01%
29917.2%
[
3.5%
-
4.0%
]
3.66%
15,3735.9%
[
4.5%
-
5.0%
]
4.67%
75017.3%
[
5.5%
-
6.0%
]
5.86%
8,5005.4%
[
7.0%
-
7.5%
]
7.34%
7902.5%
[
7.5%
-
8.0%
]
7.50%
9,1839.2%
[
7.5%
-
8.0%
]
7.78%
1,7479.2%
[
8.5%
-
9.0%
]
8.70%
3,1027.2%
[
13.0%
-
13.5%
]
13.24%
1,2241.9%
[
14.5%
-
15.0%
]
14.67%
1,6369.2%
[
15.0%
-
15.5%
]
15.29%
1,5709.7%
[
21.5%
-
22.0%
]
21.68%
64119.0%
[
21.5%
-
22.0%
]
21.85%
4217.0%
[
28.0%
-
28.5%
]
28.26%
86718.8%
[
32.5%
-
33.0%
]
32.51%
28322.7%
[
45.5%
-
46.0%
]
45.54%
9205.1%
[
47.0%
-
47.5%
]
47.43%
7216.4%
[
53.0%
-
53.5%
]
53.29%
30413.9%
[
76.5%
-
77.0%
]
76.77%
96026.4%
[
77.0%
-
77.5%
]
77.23%
1,14225.2%
[
78.5%
-
79.0%
]
78.68%
33333.3%
[
81.5%
-
82.0%
]
81.91%
30433.3%