Yup'ik Married-Couple Family Poverty

COMPARE

Yup'ik
Race
Ancestry
AfghanAfricanAlaska NativeAlaskan AthabascanAlbanianAleutAlsatianAmericanApacheArabArapahoArgentineanArmenianAssyrian/Chaldean/SyriacAustralianAustrianBahamianBangladeshiBarbadianBasqueBelgianBelizeanBermudanBhutaneseBlackfeetBolivianBrazilianBritishBritish West IndianBulgarianBurmeseCajunCambodianCanadianCape VerdeanCarpatho RusynCelticCentral AmericanCentral American IndianCherokeeCheyenneChickasawChileanChineseChippewaChoctawColombianColvilleComancheCosta RicanCreeCreekCroatianCrowCubanCypriotCzechCzechoslovakianDanishDelawareDominicanDutchDutch West IndianEastern EuropeanEcuadorianEgyptianEnglishEstonianEthiopianEuropeanFijianFilipinoFinnishFrenchFrench American IndianFrench CanadianGermanGerman RussianGhanaianGreekGuamanian/ChamorroGuatemalanGuyaneseHaitianHmongHonduranHopiHoumaHungarianIcelanderIndian (Asian)IndonesianInupiatIranianIraqiIrishIroquoisIsraeliItalianJamaicanJapaneseJordanianKenyanKiowaKoreanLaotianLatvianLebaneseLiberianLithuanianLumbeeLuxembourgerMacedonianMalaysianMalteseMarshalleseMenomineeMexicanMexican American IndianMongolianMoroccanNative HawaiianNavajoNepaleseNew ZealanderNicaraguanNigerianNorthern EuropeanNorwegianOkinawanOsageOttawaPaiutePakistaniPalestinianPanamanianParaguayanPennsylvania GermanPeruvianPimaPolishPortuguesePotawatomiPuebloPuerto RicanPuget Sound SalishRomanianRussianSalvadoranSamoanScandinavianScotch-IrishScottishSeminoleSenegaleseSerbianShoshoneSierra LeoneanSiouxSlavicSlovakSloveneSomaliSouth AfricanSouth AmericanSouth American IndianSoviet UnionSpaniardSpanishSpanish AmericanSpanish American IndianSri LankanSubsaharan AfricanSudaneseSwedishSwissSyrianTaiwaneseThaiTlingit-HaidaTohono O'OdhamTonganTrinidadian and TobagonianTsimshianTurkishU.S. Virgin IslanderUgandanUkrainianUruguayanUteVenezuelanVietnameseWelshWest IndianYakamaYaquiYugoslavianYumanYup'ikZimbabwean
Immigration
NonimmigrantsImmigrantsAfghanistanAfricaAlbaniaArgentinaArmeniaAsiaAustraliaAustriaBahamasBangladeshBarbadosBelarusBelgiumBelizeBoliviaBosnia and HerzegovinaBrazilBulgariaBurma/MyanmarCabo VerdeCambodiaCameroonCanadaCaribbeanCentral AmericaChileChinaColombiaCongoCosta RicaCroatiaCubaCzechoslovakiaDenmarkDominicaDominican RepublicEastern AfricaEastern AsiaEastern EuropeEcuadorEgyptEl SalvadorEnglandEritreaEthiopiaEuropeFijiFranceGermanyGhanaGreeceGrenadaGuatemalaGuyanaHaitiHondurasHong KongHungaryIndiaIndonesiaIranIraqIrelandIsraelItalyJamaicaJapanJordanKazakhstanKenyaKoreaKuwaitLaosLatin AmericaLatviaLebanonLiberiaLithuaniaMalaysiaMexicoMicronesiaMiddle AfricaMoldovaMoroccoNepalNetherlandsNicaraguaNigeriaNorth AmericaNorth MacedoniaNorthern AfricaNorthern EuropeNorwayOceaniaPakistanPanamaPeruPhilippinesPolandPortugalRomaniaRussiaSaudi ArabiaScotlandSenegalSerbiaSierra LeoneSingaporeSomaliaSouth AfricaSouth AmericaSouth Central AsiaSouth Eastern AsiaSouthern EuropeSpainSri LankaSt. Vincent and the GrenadinesSudanSwedenSwitzerlandSyriaTaiwanThailandTrinidad and TobagoTurkeyUgandaUkraineUruguayUzbekistanVenezuelaVietnamWest IndiesWestern AfricaWestern AsiaWestern EuropeYemenZaireZimbabweAzores
Select to Compare
Race
Ancestry
AfghanAfricanAlaska NativeAlaskan AthabascanAlbanianAleutAlsatianAmericanApacheArabArapahoArgentineanArmenianAssyrian/Chaldean/SyriacAustralianAustrianBahamianBangladeshiBarbadianBasqueBelgianBelizeanBermudanBhutaneseBlackfeetBolivianBrazilianBritishBritish West IndianBulgarianBurmeseCajunCambodianCanadianCape VerdeanCarpatho RusynCelticCentral AmericanCentral American IndianCherokeeCheyenneChickasawChileanChineseChippewaChoctawColombianColvilleComancheCosta RicanCreeCreekCroatianCrowCubanCypriotCzechCzechoslovakianDanishDelawareDominicanDutchDutch West IndianEastern EuropeanEcuadorianEgyptianEnglishEstonianEthiopianEuropeanFijianFilipinoFinnishFrenchFrench American IndianFrench CanadianGermanGerman RussianGhanaianGreekGuamanian/ChamorroGuatemalanGuyaneseHaitianHmongHonduranHopiHoumaHungarianIcelanderIndian (Asian)IndonesianInupiatIranianIraqiIrishIroquoisIsraeliItalianJamaicanJapaneseJordanianKenyanKiowaKoreanLaotianLatvianLebaneseLiberianLithuanianLumbeeLuxembourgerMacedonianMalaysianMalteseMarshalleseMenomineeMexicanMexican American IndianMongolianMoroccanNative HawaiianNavajoNepaleseNew ZealanderNicaraguanNigerianNorthern EuropeanNorwegianOkinawanOsageOttawaPaiutePakistaniPalestinianPanamanianParaguayanPennsylvania GermanPeruvianPimaPolishPortuguesePotawatomiPuebloPuerto RicanPuget Sound SalishRomanianRussianSalvadoranSamoanScandinavianScotch-IrishScottishSeminoleSenegaleseSerbianShoshoneSierra LeoneanSiouxSlavicSlovakSloveneSomaliSouth AfricanSouth AmericanSouth American IndianSoviet UnionSpaniardSpanishSpanish AmericanSpanish American IndianSri LankanSubsaharan AfricanSudaneseSwedishSwissSyrianTaiwaneseThaiTlingit-HaidaTohono O'OdhamTonganTrinidadian and TobagonianTsimshianTurkishU.S. Virgin IslanderUgandanUkrainianUruguayanUteVenezuelanVietnameseWelshWest IndianYakamaYaquiYugoslavianYumanZimbabwean
Immigration
NonimmigrantsImmigrantsAfghanistanAfricaAlbaniaArgentinaArmeniaAsiaAustraliaAustriaBahamasBangladeshBarbadosBelarusBelgiumBelizeBoliviaBosnia and HerzegovinaBrazilBulgariaBurma/MyanmarCabo VerdeCambodiaCameroonCanadaCaribbeanCentral AmericaChileChinaColombiaCongoCosta RicaCroatiaCubaCzechoslovakiaDenmarkDominicaDominican RepublicEastern AfricaEastern AsiaEastern EuropeEcuadorEgyptEl SalvadorEnglandEritreaEthiopiaEuropeFijiFranceGermanyGhanaGreeceGrenadaGuatemalaGuyanaHaitiHondurasHong KongHungaryIndiaIndonesiaIranIraqIrelandIsraelItalyJamaicaJapanJordanKazakhstanKenyaKoreaKuwaitLaosLatin AmericaLatviaLebanonLiberiaLithuaniaMalaysiaMexicoMicronesiaMiddle AfricaMoldovaMoroccoNepalNetherlandsNicaraguaNigeriaNorth AmericaNorth MacedoniaNorthern AfricaNorthern EuropeNorwayOceaniaPakistanPanamaPeruPhilippinesPolandPortugalRomaniaRussiaSaudi ArabiaScotlandSenegalSerbiaSierra LeoneSingaporeSomaliaSouth AfricaSouth AmericaSouth Central AsiaSouth Eastern AsiaSouthern EuropeSpainSri LankaSt. Vincent and the GrenadinesSudanSwedenSwitzerlandSyriaTaiwanThailandTrinidad and TobagoTurkeyUgandaUkraineUruguayUzbekistanVenezuelaVietnamWest IndiesWestern AfricaWestern AsiaWestern EuropeYemenZaireZimbabweAzores
Married-Couple Family Poverty
Income
Poverty
Unemployment
Labor Participation
Family Structure
Vehicle Availability
Education Level
Disability

Yup'ik Married-Couple Family Poverty
Tragic

13.4%
POVERTY | MARRIED-COUPLE FAMILIES
0.0/ 100
METRIC RATING
347th/ 347
METRIC RANK

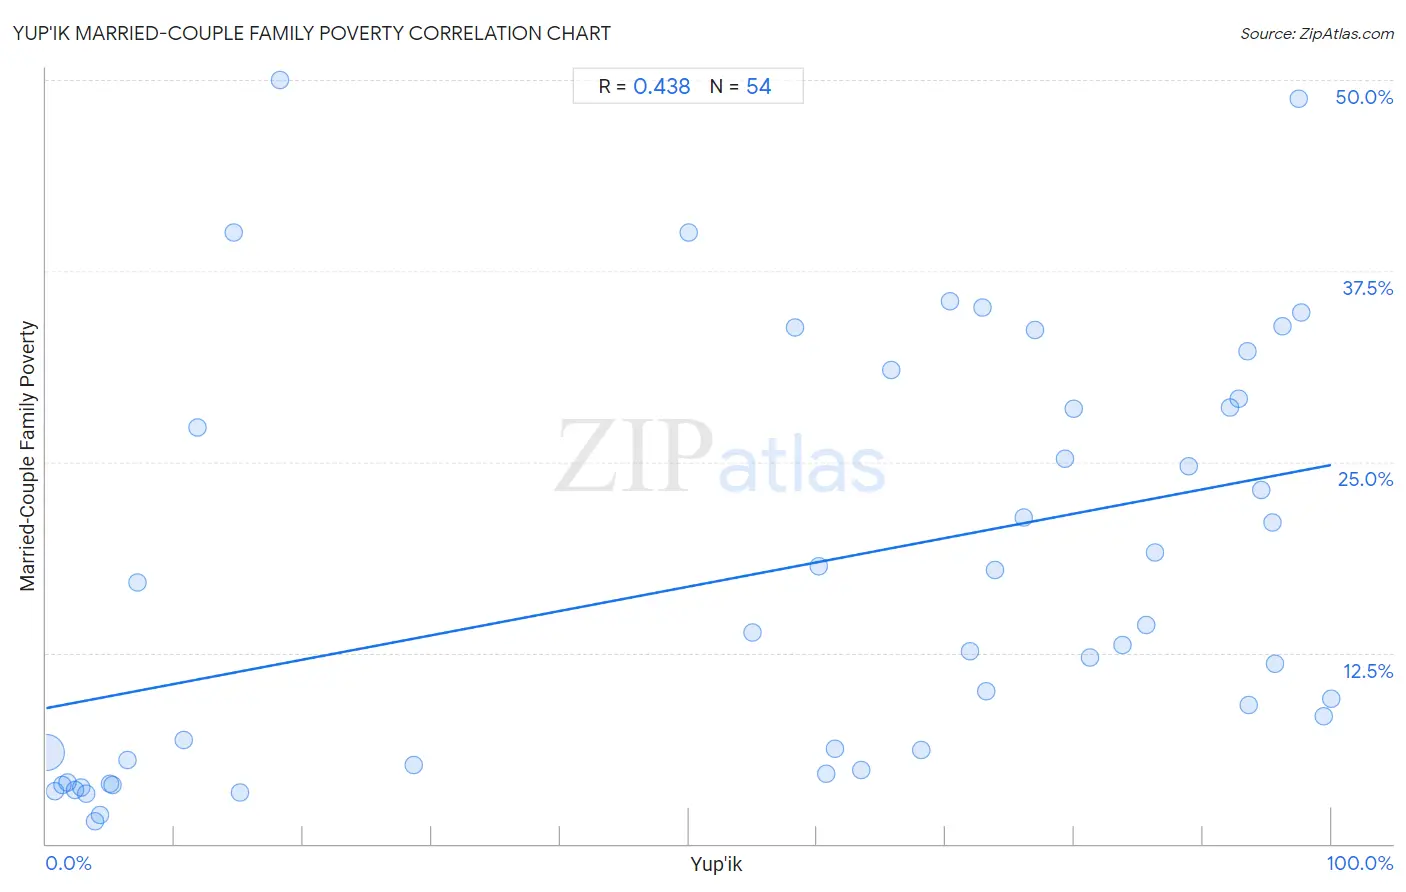
Yup'ik Married-Couple Family Poverty Correlation Chart

The statistical analysis conducted on geographies consisting of 39,863,865 people shows a moderate positive correlation between the proportion of Yup'ik and poverty level among married-couple families in the United States with a correlation coefficient (R) of 0.438 and weighted average of 13.4%. On average, for every 1% (one percent) increase in Yup'ik within a typical geography, there is an increase of 0.16% in poverty level among married-couple families.
Yup'ik Married-Couple Family Poverty
It is essential to understand that the correlation between the percentage of Yup'ik and poverty level among married-couple families does not imply a direct cause-and-effect relationship. It remains uncertain whether the presence of Yup'ik influences an upward or downward trend in the level of poverty level among married-couple families within an area, or if Yup'ik simply ended up residing in those areas with higher or lower levels of poverty level among married-couple families due to other factors.

Demographics Similar to Yup'ik by Married-Couple Family Poverty

In terms of married-couple family poverty, the demographic groups most similar to Yup'ik are Immigrants from Yemen (12.8%, a difference of 4.6%), Puerto Rican (12.6%, a difference of 6.0%), Navajo (11.9%, a difference of 13.0%), Pima (11.4%, a difference of 17.4%), and Tohono O'odham (11.2%, a difference of 19.3%).
DemographicsRating | RankMarried-Couple Family Poverty
Lumbee
0.0
/100
|
#333
Tragic
8.3%
Immigrants from Dominican Republic
0.0
/100
|
#334
Tragic
8.4%
Sioux
0.0
/100
|
#335
Tragic
8.7%
Apache
0.0
/100
|
#336
Tragic
9.0%
Yakama
0.0
/100
|
#337
Tragic
9.0%
Cheyenne
0.0
/100
|
#338
Tragic
9.4%
Crow
0.0
/100
|
#339
Tragic
9.6%
Yuman
0.0
/100
|
#340
Tragic
9.7%
Pueblo
0.0
/100
|
#341
Tragic
11.1%
Tohono O'odham
0.0
/100
|
#342
Tragic
11.2%
Pima
0.0
/100
|
#343
Tragic
11.4%
Navajo
0.0
/100
|
#344
Tragic
11.9%
Puerto Ricans
0.0
/100
|
#345
Tragic
12.6%
Immigrants from Yemen
0.0
/100
|
#346
Tragic
12.8%
Yup'ik
0.0
/100
|
#347
Tragic
13.4%

Yup'ik Married-Couple Family Poverty Correlation Summary

MeasurementYup'ik DataMarried-Couple Family Poverty Data
Minimum0.021%1.5%
Maximum100.0%50.0%
Range100.0%48.5%
Mean54.3%17.5%
Median67.0%13.4%
Interquartile 25% (IQ1)10.7%5.1%
Interquartile 75% (IQ3)86.3%28.6%
Interquartile Range (IQR)75.6%23.4%
Standard Deviation (Sample)37.0%13.4%
Standard Deviation (Population)36.6%13.3%

Correlation Details

Yup'ik PercentileSample SizeMarried-Couple Family Poverty
[
0.0%
-
0.5%
]
0.021%
38,634,0426.0%
[
0.5%
-
1.0%
]
0.66%
249,3143.5%
[
1.0%
-
1.5%
]
1.22%
179,1923.9%
[
1.5%
-
2.0%
]
1.66%
89,2534.0%
[
2.0%
-
2.5%
]
2.28%
91,3903.6%
[
2.5%
-
3.0%
]
2.77%
54,8473.6%
[
3.0%
-
3.5%
]
3.10%
319,8453.3%
[
3.5%
-
4.0%
]
3.75%
20,6971.5%
[
4.0%
-
4.5%
]
4.15%
26,3811.8%
[
4.5%
-
5.0%
]
4.96%
30,6624.0%
[
5.0%
-
5.5%
]
5.12%
59,6493.9%
[
6.0%
-
6.5%
]
6.33%
38,7935.5%
[
7.0%
-
7.5%
]
7.14%
95217.1%
[
10.5%
-
11.0%
]
10.73%
1,5756.8%
[
11.5%
-
12.0%
]
11.76%
5127.3%
[
14.5%
-
15.0%
]
14.63%
4140.0%
[
15.0%
-
15.5%
]
15.07%
8363.4%
[
18.0%
-
18.5%
]
18.20%
91250.0%
[
28.5%
-
29.0%
]
28.57%
6305.1%
[
50.0%
-
50.5%
]
50.00%
86440.0%
[
54.5%
-
55.0%
]
54.98%
1,76813.8%
[
58.0%
-
58.5%
]
58.30%
1,60233.8%
[
60.0%
-
60.5%
]
60.14%
71518.2%
[
60.5%
-
61.0%
]
60.74%
2,1754.6%
[
61.0%
-
61.5%
]
61.34%
5516.2%
[
63.0%
-
63.5%
]
63.45%
2,5774.8%
[
65.5%
-
66.0%
]
65.78%
90031.0%
[
68.0%
-
68.5%
]
68.12%
6,3126.1%
[
70.0%
-
70.5%
]
70.36%
83035.5%
[
71.5%
-
72.0%
]
71.84%
8,15712.6%
[
72.5%
-
73.0%
]
72.89%
76035.1%
[
73.0%
-
73.5%
]
73.15%
59610.0%
[
73.5%
-
74.0%
]
73.79%
1,44218.0%
[
76.0%
-
76.5%
]
76.04%
1,82821.4%
[
76.5%
-
77.0%
]
76.99%
84333.6%
[
79.0%
-
79.5%
]
79.27%
2,31625.2%
[
79.5%
-
80.0%
]
79.92%
4,18428.5%
[
81.0%
-
81.5%
]
81.19%
1,30812.2%
[
83.5%
-
84.0%
]
83.77%
61613.0%
[
85.5%
-
86.0%
]
85.63%
5,35814.3%
[
86.0%
-
86.5%
]
86.29%
99219.0%
[
88.5%
-
89.0%
]
88.91%
3,38924.7%
[
92.0%
-
92.5%
]
92.16%
10228.6%
[
92.5%
-
93.0%
]
92.76%
4,55829.1%
[
93.0%
-
93.5%
]
93.49%
61432.3%
[
93.5%
-
94.0%
]
93.59%
2349.1%
[
94.5%
-
95.0%
]
94.53%
95023.2%
[
95.0%
-
95.5%
]
95.40%
3,12821.0%
[
95.5%
-
96.0%
]
95.59%
1,17811.8%
[
96.0%
-
96.5%
]
96.20%
2,15633.9%
[
97.0%
-
97.5%
]
97.43%
77848.8%
[
97.5%
-
98.0%
]
97.67%
43034.8%
[
99.0%
-
99.5%
]
99.43%
3538.3%
[
99.5%
-
100.0%
]
100.00%
2399.5%