Immigrants from Scotland Married-Couple Family Poverty

COMPARE

Immigrants from Scotland
Race
Ancestry
AfghanAfricanAlaska NativeAlaskan AthabascanAlbanianAleutAlsatianAmericanApacheArabArapahoArgentineanArmenianAssyrian/Chaldean/SyriacAustralianAustrianBahamianBangladeshiBarbadianBasqueBelgianBelizeanBermudanBhutaneseBlackfeetBolivianBrazilianBritishBritish West IndianBulgarianBurmeseCajunCambodianCanadianCape VerdeanCarpatho RusynCelticCentral AmericanCentral American IndianCherokeeCheyenneChickasawChileanChineseChippewaChoctawColombianColvilleComancheCosta RicanCreeCreekCroatianCrowCubanCypriotCzechCzechoslovakianDanishDelawareDominicanDutchDutch West IndianEastern EuropeanEcuadorianEgyptianEnglishEstonianEthiopianEuropeanFijianFilipinoFinnishFrenchFrench American IndianFrench CanadianGermanGerman RussianGhanaianGreekGuamanian/ChamorroGuatemalanGuyaneseHaitianHmongHonduranHopiHoumaHungarianIcelanderIndian (Asian)IndonesianInupiatIranianIraqiIrishIroquoisIsraeliItalianJamaicanJapaneseJordanianKenyanKiowaKoreanLaotianLatvianLebaneseLiberianLithuanianLumbeeLuxembourgerMacedonianMalaysianMalteseMarshalleseMenomineeMexicanMexican American IndianMongolianMoroccanNative HawaiianNavajoNepaleseNew ZealanderNicaraguanNigerianNorthern EuropeanNorwegianOkinawanOsageOttawaPaiutePakistaniPalestinianPanamanianParaguayanPennsylvania GermanPeruvianPimaPolishPortuguesePotawatomiPuebloPuerto RicanPuget Sound SalishRomanianRussianSalvadoranSamoanScandinavianScotch-IrishScottishSeminoleSenegaleseSerbianShoshoneSierra LeoneanSiouxSlavicSlovakSloveneSomaliSouth AfricanSouth AmericanSouth American IndianSoviet UnionSpaniardSpanishSpanish AmericanSpanish American IndianSri LankanSubsaharan AfricanSudaneseSwedishSwissSyrianTaiwaneseThaiTlingit-HaidaTohono O'OdhamTonganTrinidadian and TobagonianTsimshianTurkishU.S. Virgin IslanderUgandanUkrainianUruguayanUteVenezuelanVietnameseWelshWest IndianYakamaYaquiYugoslavianYumanYup'ikZimbabwean
Immigration
NonimmigrantsImmigrantsAfghanistanAfricaAlbaniaArgentinaArmeniaAsiaAustraliaAustriaBahamasBangladeshBarbadosBelarusBelgiumBelizeBoliviaBosnia and HerzegovinaBrazilBulgariaBurma/MyanmarCabo VerdeCambodiaCameroonCanadaCaribbeanCentral AmericaChileChinaColombiaCongoCosta RicaCroatiaCubaCzechoslovakiaDenmarkDominicaDominican RepublicEastern AfricaEastern AsiaEastern EuropeEcuadorEgyptEl SalvadorEnglandEritreaEthiopiaEuropeFijiFranceGermanyGhanaGreeceGrenadaGuatemalaGuyanaHaitiHondurasHong KongHungaryIndiaIndonesiaIranIraqIrelandIsraelItalyJamaicaJapanJordanKazakhstanKenyaKoreaKuwaitLaosLatin AmericaLatviaLebanonLiberiaLithuaniaMalaysiaMexicoMicronesiaMiddle AfricaMoldovaMoroccoNepalNetherlandsNicaraguaNigeriaNorth AmericaNorth MacedoniaNorthern AfricaNorthern EuropeNorwayOceaniaPakistanPanamaPeruPhilippinesPolandPortugalRomaniaRussiaSaudi ArabiaScotlandSenegalSerbiaSierra LeoneSingaporeSomaliaSouth AfricaSouth AmericaSouth Central AsiaSouth Eastern AsiaSouthern EuropeSpainSri LankaSt. Vincent and the GrenadinesSudanSwedenSwitzerlandSyriaTaiwanThailandTrinidad and TobagoTurkeyUgandaUkraineUruguayUzbekistanVenezuelaVietnamWest IndiesWestern AfricaWestern AsiaWestern EuropeYemenZaireZimbabweAzores
Select to Compare
Race
Ancestry
AfghanAfricanAlaska NativeAlaskan AthabascanAlbanianAleutAlsatianAmericanApacheArabArapahoArgentineanArmenianAssyrian/Chaldean/SyriacAustralianAustrianBahamianBangladeshiBarbadianBasqueBelgianBelizeanBermudanBhutaneseBlackfeetBolivianBrazilianBritishBritish West IndianBulgarianBurmeseCajunCambodianCanadianCape VerdeanCarpatho RusynCelticCentral AmericanCentral American IndianCherokeeCheyenneChickasawChileanChineseChippewaChoctawColombianColvilleComancheCosta RicanCreeCreekCroatianCrowCubanCypriotCzechCzechoslovakianDanishDelawareDominicanDutchDutch West IndianEastern EuropeanEcuadorianEgyptianEnglishEstonianEthiopianEuropeanFijianFilipinoFinnishFrenchFrench American IndianFrench CanadianGermanGerman RussianGhanaianGreekGuamanian/ChamorroGuatemalanGuyaneseHaitianHmongHonduranHopiHoumaHungarianIcelanderIndian (Asian)IndonesianInupiatIranianIraqiIrishIroquoisIsraeliItalianJamaicanJapaneseJordanianKenyanKiowaKoreanLaotianLatvianLebaneseLiberianLithuanianLumbeeLuxembourgerMacedonianMalaysianMalteseMarshalleseMenomineeMexicanMexican American IndianMongolianMoroccanNative HawaiianNavajoNepaleseNew ZealanderNicaraguanNigerianNorthern EuropeanNorwegianOkinawanOsageOttawaPaiutePakistaniPalestinianPanamanianParaguayanPennsylvania GermanPeruvianPimaPolishPortuguesePotawatomiPuebloPuerto RicanPuget Sound SalishRomanianRussianSalvadoranSamoanScandinavianScotch-IrishScottishSeminoleSenegaleseSerbianShoshoneSierra LeoneanSiouxSlavicSlovakSloveneSomaliSouth AfricanSouth AmericanSouth American IndianSoviet UnionSpaniardSpanishSpanish AmericanSpanish American IndianSri LankanSubsaharan AfricanSudaneseSwedishSwissSyrianTaiwaneseThaiTlingit-HaidaTohono O'OdhamTonganTrinidadian and TobagonianTsimshianTurkishU.S. Virgin IslanderUgandanUkrainianUruguayanUteVenezuelanVietnameseWelshWest IndianYakamaYaquiYugoslavianYumanYup'ikZimbabwean
Immigration
NonimmigrantsImmigrantsAfghanistanAfricaAlbaniaArgentinaArmeniaAsiaAustraliaAustriaBahamasBangladeshBarbadosBelarusBelgiumBelizeBoliviaBosnia and HerzegovinaBrazilBulgariaBurma/MyanmarCabo VerdeCambodiaCameroonCanadaCaribbeanCentral AmericaChileChinaColombiaCongoCosta RicaCroatiaCubaCzechoslovakiaDenmarkDominicaDominican RepublicEastern AfricaEastern AsiaEastern EuropeEcuadorEgyptEl SalvadorEnglandEritreaEthiopiaEuropeFijiFranceGermanyGhanaGreeceGrenadaGuatemalaGuyanaHaitiHondurasHong KongHungaryIndiaIndonesiaIranIraqIrelandIsraelItalyJamaicaJapanJordanKazakhstanKenyaKoreaKuwaitLaosLatin AmericaLatviaLebanonLiberiaLithuaniaMalaysiaMexicoMicronesiaMiddle AfricaMoldovaMoroccoNepalNetherlandsNicaraguaNigeriaNorth AmericaNorth MacedoniaNorthern AfricaNorthern EuropeNorwayOceaniaPakistanPanamaPeruPhilippinesPolandPortugalRomaniaRussiaSaudi ArabiaSenegalSerbiaSierra LeoneSingaporeSomaliaSouth AfricaSouth AmericaSouth Central AsiaSouth Eastern AsiaSouthern EuropeSpainSri LankaSt. Vincent and the GrenadinesSudanSwedenSwitzerlandSyriaTaiwanThailandTrinidad and TobagoTurkeyUgandaUkraineUruguayUzbekistanVenezuelaVietnamWest IndiesWestern AfricaWestern AsiaWestern EuropeYemenZaireZimbabweAzores
Married-Couple Family Poverty
Income
Poverty
Unemployment
Labor Participation
Family Structure
Vehicle Availability
Education Level
Disability

Immigrants from Scotland Married-Couple Family Poverty
Exceptional

4.2%
POVERTY | MARRIED-COUPLE FAMILIES
99.9/ 100
METRIC RATING
29th/ 347
METRIC RANK

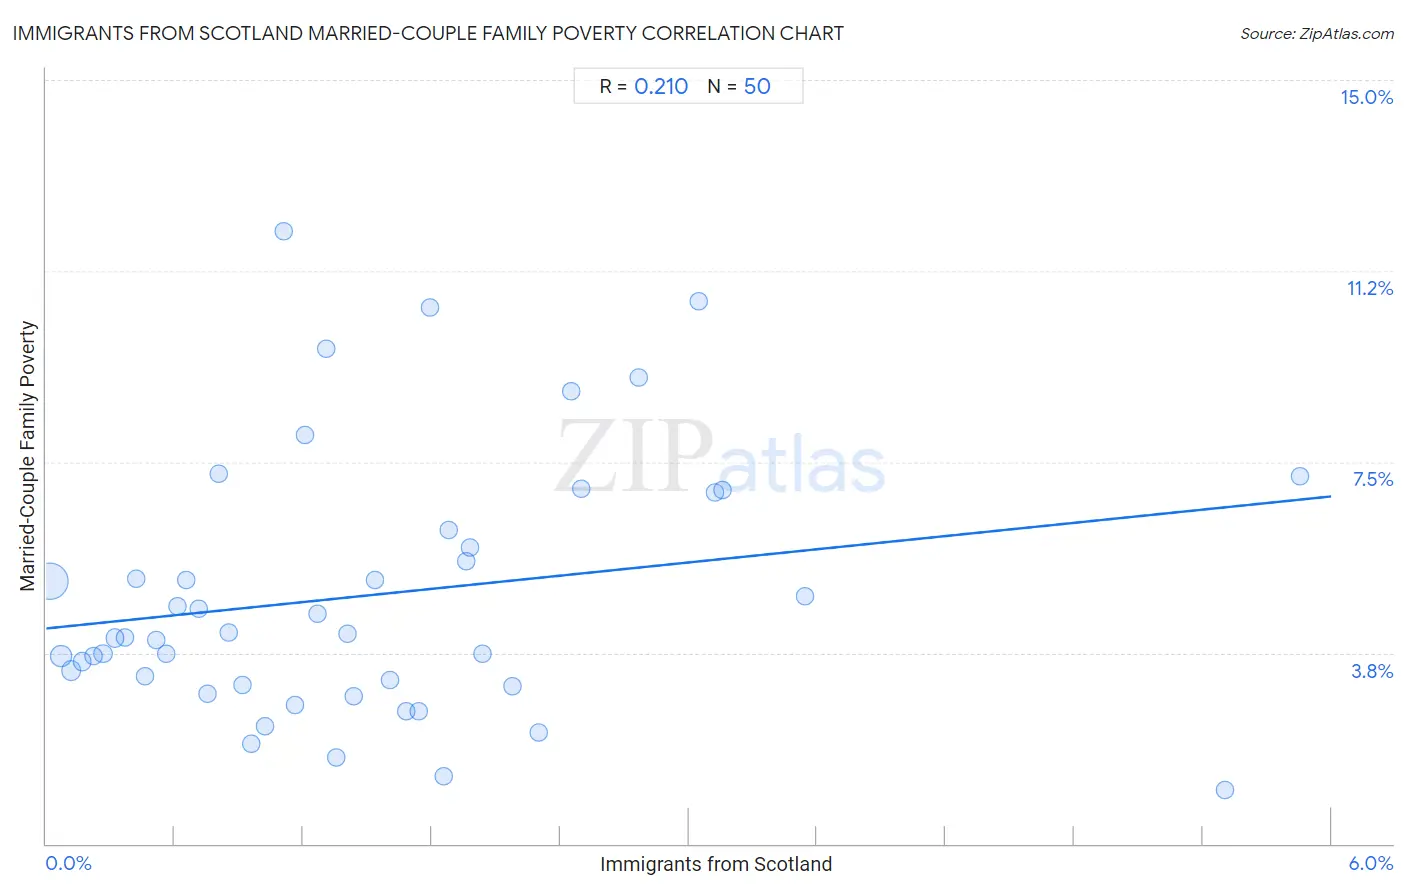
Immigrants from Scotland Married-Couple Family Poverty Correlation Chart

The statistical analysis conducted on geographies consisting of 195,462,038 people shows a weak positive correlation between the proportion of Immigrants from Scotland and poverty level among married-couple families in the United States with a correlation coefficient (R) of 0.210 and weighted average of 4.2%. On average, for every 1% (one percent) increase in Immigrants from Scotland within a typical geography, there is an increase of 0.43% in poverty level among married-couple families.
Immigrants from Scotland Married-Couple Family Poverty
It is essential to understand that the correlation between the percentage of Immigrants from Scotland and poverty level among married-couple families does not imply a direct cause-and-effect relationship. It remains uncertain whether the presence of Immigrants from Scotland influences an upward or downward trend in the level of poverty level among married-couple families within an area, or if Immigrants from Scotland simply ended up residing in those areas with higher or lower levels of poverty level among married-couple families due to other factors.

Demographics Similar to Immigrants from Scotland by Married-Couple Family Poverty

In terms of married-couple family poverty, the demographic groups most similar to Immigrants from Scotland are Scandinavian (4.1%, a difference of 0.040%), Danish (4.1%, a difference of 0.15%), Finnish (4.2%, a difference of 0.24%), Cypriot (4.1%, a difference of 0.26%), and Estonian (4.2%, a difference of 0.32%).
DemographicsRating | RankMarried-Couple Family Poverty
Immigrants from Singapore
99.9
/100
|
#22
Exceptional
4.1%
Bhutanese
99.9
/100
|
#23
Exceptional
4.1%
Eastern Europeans
99.9
/100
|
#24
Exceptional
4.1%
Immigrants from Taiwan
99.9
/100
|
#25
Exceptional
4.1%
Cypriots
99.9
/100
|
#26
Exceptional
4.1%
Danes
99.9
/100
|
#27
Exceptional
4.1%
Scandinavians
99.9
/100
|
#28
Exceptional
4.1%
Immigrants from Scotland
99.9
/100
|
#29
Exceptional
4.2%
Finns
99.9
/100
|
#30
Exceptional
4.2%
Estonians
99.9
/100
|
#31
Exceptional
4.2%
Greeks
99.9
/100
|
#32
Exceptional
4.2%
Irish
99.9
/100
|
#33
Exceptional
4.2%
Dutch
99.9
/100
|
#34
Exceptional
4.2%
Europeans
99.9
/100
|
#35
Exceptional
4.2%
English
99.9
/100
|
#36
Exceptional
4.2%

Immigrants from Scotland Married-Couple Family Poverty Correlation Summary

MeasurementImmigrants from Scotland DataMarried-Couple Family Poverty Data
Minimum0.020%1.1%
Maximum5.9%12.0%
Range5.8%11.0%
Mean1.5%4.9%
Median1.3%4.1%
Interquartile 25% (IQ1)0.61%3.1%
Interquartile 75% (IQ3)2.0%6.2%
Interquartile Range (IQR)1.4%3.1%
Standard Deviation (Sample)1.2%2.6%
Standard Deviation (Population)1.2%2.5%

Correlation Details

Immigrants from Scotland PercentileSample SizeMarried-Couple Family Poverty
[
0.0%
-
0.5%
]
0.020%
142,045,8535.1%
[
0.0%
-
0.5%
]
0.069%
31,036,1393.7%
[
0.0%
-
0.5%
]
0.12%
10,077,1213.4%
[
0.0%
-
0.5%
]
0.17%
4,698,3483.6%
[
0.0%
-
0.5%
]
0.22%
2,851,5963.7%
[
0.0%
-
0.5%
]
0.27%
1,383,3913.7%
[
0.0%
-
0.5%
]
0.32%
971,2774.0%
[
0.0%
-
0.5%
]
0.37%
568,4924.0%
[
0.0%
-
0.5%
]
0.42%
404,4475.2%
[
0.0%
-
0.5%
]
0.46%
365,5873.3%
[
0.5%
-
1.0%
]
0.51%
286,1324.0%
[
0.5%
-
1.0%
]
0.56%
105,7573.7%
[
0.5%
-
1.0%
]
0.61%
137,5434.7%
[
0.5%
-
1.0%
]
0.66%
83,1955.2%
[
0.5%
-
1.0%
]
0.71%
103,4984.6%
[
0.5%
-
1.0%
]
0.75%
29,6722.9%
[
0.5%
-
1.0%
]
0.80%
19,5597.3%
[
0.5%
-
1.0%
]
0.85%
58,4264.1%
[
0.5%
-
1.0%
]
0.92%
19,3323.1%
[
0.5%
-
1.0%
]
0.96%
33,6842.0%
[
1.0%
-
1.5%
]
1.02%
19,3882.3%
[
1.0%
-
1.5%
]
1.11%
2,61112.0%
[
1.0%
-
1.5%
]
1.16%
22,2892.7%
[
1.0%
-
1.5%
]
1.21%
3,3108.0%
[
1.0%
-
1.5%
]
1.27%
21,3284.5%
[
1.0%
-
1.5%
]
1.31%
1,5289.7%
[
1.0%
-
1.5%
]
1.35%
33,5441.7%
[
1.0%
-
1.5%
]
1.41%
18,8564.1%
[
1.0%
-
1.5%
]
1.43%
7,2542.9%
[
1.5%
-
2.0%
]
1.53%
3915.2%
[
1.5%
-
2.0%
]
1.61%
8,4013.2%
[
1.5%
-
2.0%
]
1.68%
3,3292.6%
[
1.5%
-
2.0%
]
1.74%
6,2102.6%
[
1.5%
-
2.0%
]
1.79%
27910.5%
[
1.5%
-
2.0%
]
1.86%
7,4301.3%
[
1.5%
-
2.0%
]
1.88%
3,1916.2%
[
1.5%
-
2.0%
]
1.96%
8665.6%
[
1.5%
-
2.0%
]
1.98%
2,9785.8%
[
2.0%
-
2.5%
]
2.03%
2,9003.7%
[
2.0%
-
2.5%
]
2.17%
2,0233.1%
[
2.0%
-
2.5%
]
2.30%
1,2602.2%
[
2.0%
-
2.5%
]
2.45%
1638.9%
[
2.0%
-
2.5%
]
2.50%
2407.0%
[
2.5%
-
3.0%
]
2.77%
4,8809.2%
[
3.0%
-
3.5%
]
3.04%
3,12010.6%
[
3.0%
-
3.5%
]
3.12%
1,8246.9%
[
3.0%
-
3.5%
]
3.16%
8877.0%
[
3.5%
-
4.0%
]
3.54%
1,1014.9%
[
5.5%
-
6.0%
]
5.50%
9811.1%
[
5.5%
-
6.0%
]
5.85%
4277.2%